

Using temperature loggers to monitor den box use by American martens, fishers, and tree squirrels
Joyce, M.J., Velander, T.B., McMahon, M.C., & Moen, R.A. (2025). Using temperature loggers to monitor den box use by American martens, fishers, and tree squirrels. Stacks Journal: 25003. https://doi.org/10.60102/stacks-25003

Abstract photo. A fisher at a fisher den box in Minnesota, USA. Photo credit: Ryan Pennesi.
Abstract
Tree cavities are keystone habitat resources used by many animal species. Artificial den boxes can provide habitat for cavity-dependent wildlife where natural cavities are rare and have been used to address a variety of conservation, research, and management objectives. Accurate, cost-effective methods are needed to monitor den boxes to meet research and management objectives. Recent studies have used temperature loggers to monitor den box use, often using the warming effect of animal presence to detect presence of animals in den boxes. While effective, these studies have been unable to distinguish different species using den boxes from temperature data. Here, we describe a novel method for monitoring den boxes using internal temperature loggers that relies on temperature rate of change values. Our objectives were to describe the pattern of temperature rate of change corresponding to uses of den boxes by American martens, fishers, and tree squirrels; evaluate how effectively temperature rate of change could detect uses by these species; and evaluate whether temperature rate of change could be used to identify the species using den boxes. We built and installed 86 fisher den boxes in northern Minnesota, USA and monitored each box year-round for 3 years after installation using remote cameras and internal temperature loggers. We found that temperature rate of change showed a consistent pattern when animals entered, remained in, and then left the den box. Using temperature loggers, we were able to successfully identify all instances in which remote cameras documented fishers and martens using den boxes, but we rarely detected use by tree squirrels. The rate of change pattern when fishers used den boxes was statistically different from the pattern when martens used den boxes, demonstrating that species identification from temperature data is possible. Temperature loggers are an accurate, cost-effective method for monitoring den boxes to aid wildlife conservation, research, and management.
Keywords: artificial cavity, Glaucomys sabrinus, Glaucomys volans, Martes americana, nest box, Pekania pennanti, Sciurus carolinensis, Tamiasciurus hudsonicus, temperature rate of change
Introduction
Tree cavities are keystone habitat resources that are used by many birds, mammals, insects, and other animals (Remm and Lõhmus 2011, Lindenmayer et al. 2012a). Cavity-dependent species rely on cavities for shelter from predators and weather, and rearing young (Bull 1997, Gibbons and Lindenmayer 2002, Goldingay 2009, Rueegger et al. 2012, Matthews et al. 2019). Cavity availability has been hypothesized to limit population density for many species (Burger 1969, Cockle et al. 2010, Wiebe 2011). Over the last several decades forests across the world have experienced rapid loss of large trees, including those with cavities (Laurance et al. 2000, Jönsson et al. 2009, Lutz et al. 2009, Laurance 2012, Lindenmayer et al. 2012a,b). In many forests, loss of mature trees with cavities outpaces recruitment due to forest management practices and changing natural disturbance patterns (Lindenmayer et al. 1997, Cockle et al. 2011, McDowell et al. 2020, Patacca et al. 2023), raising concerns for the conservation of cavity-dependent wildlife.
Artificial cavities (often referred to as nest boxes or den boxes; hereafter, den boxes) have been used to provide or enhance habitat for cavity-dependent wildlife where natural cavities have become rare (Harper et al. 2005, Goldingay 2017, Croose et al. 2016). Additionally, den boxes have been used to detect or monitor species (Ford et al. 2015, Smaal and van Manen 2017), investigate various den box designs to evaluate species preference (Moore et al. 2010, Rueegger et al. 2012), evaluate spatio-temporal factors influencing den box use by target and non-target species (Beyer and Goldingay 2006, Lindenmayer et al. 2009, Rueegger et al. 2012), enhance habitat prior to reintroductions (Moore et al. 2010), and aid live-capture and tagging of wildlife (Taulman 1999, Diggins et al. 2017). Further, because den boxes can be deployed in varying habitats and at varying densities, they can be used to evaluate responses of cavity-dependent wildlife to forest management (Taulman et al. 1998) or to evaluate whether cavities are limiting resources (Cockle et al. 2010, Elias and Stoleson 2021).
Accurate, cost-effective methods to monitor den box use by wildlife are needed to evaluate the success of den box programs, understand factors influencing den box use, and incorporate data on den box use into population and habitat monitoring. Methods previously used to monitor den boxes include visiting and inspecting den boxes to search for animals using boxes or sign of their use (e.g., feathers, eggs, scats; Semel and Sherman 1995, Ruegger et al. 2012, Croose et al. 2016), hair snares positioned at den box openings (Moore et al. 2010, Davis and Horley 2015), and remote cameras to monitor the outside of boxes or fiber optic cameras to monitor the inside of den boxes (Davis and Horley 2015, Delheimer et al. 2018, Zarybnicka et al. 2016). Methods vary in the type of information they provide and their time and cost efficiency. For example, visiting den boxes to search for signs of use and collect hair snares can be cost-effective if boxes are visited infrequently, but may not provide complete information on when or how den boxes were used. Frequent visits could also discourage target species from using boxes (but see Utsey and Hepp 1997). Conversely, remote cameras can provide detailed information on species visiting or using boxes and when and how boxes are used by various species but analyzing image or video data is time-consuming and expensive.
More recently, temperature loggers have been used to monitor den boxes (Moore et al. 2010, Smaal and van Manen 2017) and natural cavities (Cawthen et al. 2009). When endotherms enter a closed space like a den box, body heat lost through conduction, convection, and radiation will warm the den box, leading to an increase in internal box temperature (Kendeigh 1961, Moore et al. 2010, Smaal and van Manen 2017). In contrast, unoccupied den boxes follow natural oscillations in temperature in response to fluctuations in ambient temperature (Coombs et al. 2010, Velander et al. 2023). Previous studies using temperature loggers to monitor den box use have commonly used a pair of temperature loggers to simultaneously monitor internal and ambient temperature. Temperature of unoccupied den boxes changes slowly compared to the relatively rapid temperature change when an animal enters and remains in a den box (Kendeigh 1961, Cawthen et al. 2009, Moore et al. 2010). The rate of temperature change should vary with the size of the animal present, assuming heat loss is proportional to body size (Smaal and van Manen 2017). If the rate of temperature change accurately indicates when animals are using den boxes, it should be possible to monitor den boxes by placing a single temperature logger within each box rather than using a pair of temperature loggers to simultaneously monitor den box and ambient temperatures.
Our goal was to evaluate whether temperature rate of change data recorded by temperature loggers could be used to monitor den box use. For this study, we used fishers (Pekania pennanti), American martens (Martes americana), and four species of tree squirrels (eastern gray squirrels, Sciurus carolinensis; American red squirrels, Tamiasciurus hudsonicus; northern flying squirrels, Glaucomys sabrinus; and southern flying squirrels, G. volans) as model species for evaluating patterns of temperature change and temperature rate of change during den box use. All six species use tree cavities for resting and reproductive purposes (e.g., Koprowski 1994, Steele 1998, Holloway and Malcom 2007, Weir et al. 2012, Joyce et al. 2017, Matthews et al. 2019). Additionally, den box programs have been implemented for these and related species with a focus on conservation, habitat improvement, and species monitoring (Burger 1969, Althoff and Althoff 2001, Carey 2002, Wisconsin Dept. of Natural Resources 2014, Davis and Horley 2015, Croose et al. 2016, Delheimer et al. 2018, Joyce et al. 2022). We had three specific objectives: 1) Analyze temperature patterns: describe temperature change and temperature rate of change patterns during a subset of known den box use events documented with remote camera data; 2) Assess temperature logger data: evaluate the ability of temperature logger data to identify den box uses by fishers, martens, and squirrels using our complete set of temperature and remote camera data; and 3) Determine species identification: evaluate whether temperature rate of change can be used to identify the species using the den box.
Methods and Materials
Study area
We installed fisher den boxes in Carlton County (N = 4 boxes, 46°39’N, 92°35’W), the Chippewa National Forest and nearby Cass County and state forest land (N = 40; 46°57’N, 94°2’W), Cloquet Forestry Center (N = 4; 46°41’N, 92°33’W), and the Superior National Forest (N = 48; 47°30’N, 91°53’W) in northern Minnesota, USA. Forest type and climate varied slightly between study sites, but all areas were comprised of forests typical of the Laurentian Mixed Forest Province (Hanson and Hargrave 1996, Aaseng et al. 2011). Dominant forest types included lowland conifer forests composed of black spruce (Picea mariana), white cedar (Thuja occidentalis), and tamarack (Larix laricina) and upland forests composed of aspen (Populus spp.), birch (Betula spp.), balsam fir (Abies balsamea), white spruce (P. glauca), white pine (Pinus strobus), red pine (P. resinosa), jack pine (P. banksiana), red oak (Quercus rubra), and sugar maple (Acer saccharum). The region encompassing the study area is relatively flat, with elevations ranging from 200 m to 625 m asl. The climate in the area is continental with short summers and long, cold winters, with average July temperatures of 18.6°C and average January temperatures of -14.7°C (Berg et al. 2020). Average daily fluctuations in temperatures (average high temperatures minus average low temperatures) were 14.7°C in July and 12.2°C in January (NOAA). American martens were only present in the Superior National Forest study site, while fishers and squirrels were present in all study areas.
Den box installation and monitoring
The fisher den boxes we used for this study were built and installed for a project evaluating fisher den boxes as a habitat management tool (Joyce et al. 2022). We adapted the den box design developed by Davis and Horley (2015) to make boxes slightly smaller and lighter (Joyce and Moen 2022). The boxes were constructed with plywood on the interior and exterior surface and extruded polystyrene insulation between the plywood layers.
We monitored animal activity at den boxes using both remote cameras and temperature loggers. At each den box we placed a remote camera (Bushnell Core DS 30 MP No-glow; Browning Spec Ops Advantage; Browning Spec Ops Elite HP5) on a tree ≤3.3 m from the den box, facing the side of the box with the entrance hole. Cameras were set to take 3-5 images with the minimum delay setting between triggers (typically 1 s or less). We manually inspected remote camera photos from each den box and identified instances where animals visited or used den boxes.
We categorized animal activity at den boxes as either a use or a visit. We defined a use as any instance when an animal entered and remained in the box for at least 30 minutes (Delheimer et al. 2018). Instances where an animal was detected outside the box or when an animal entered the box but did not remain inside for 30 minutes were considered visits. We focused primarily on photo events of fishers and American martens but also analyzed events of red squirrels, gray squirrels, and flying squirrels to consider all species known to use our den boxes.
Each den box had an internal temperature logger (HOBO® UA-001-64 pendant logger or MX2201, Onset Computer Corporation, Massachusetts, USA) that was screwed to an inside wall roughly 5 cm from the top of the wood chip bedding material. Most of the temperature data used for this study came from HOBO® MX2201 temperature loggers that allow users to program, launch, and download data via Bluetooth, allowing users to communicate with the device without opening den boxes. We placed temperature loggers close to the bottom of boxes so that animals resting in den boxes would be more likely to passively heat the air around temperature loggers. Additionally, we predicted that fishers would make direct contact with temperature loggers while resting, which would likely lead to more rapid heating by conduction and a more prominent temperature signal than smaller-bodied animals using den boxes.
Temperature loggers were programmed to record temperatures at 5-minute intervals. While past studies using temperature loggers to evaluate den box use compared internal temperature to ambient temperature (e.g., Moore et al. 2010), our goal was to evaluate whether den box uses could be detected using temperature rate of change, which does not require data on ambient temperature. By reducing the need to collect ambient temperature data, researchers could rely on less equipment to achieve the same goal.
Remote cameras and temperature loggers were installed during box deployment, and monitoring occurred continuously and year-round after box installation for 2-3 years. We visited each den box once every 4 months to check boxes, change remote camera and temperature logger batteries, download temperature data and collect camera memory cards. Temperature logger data was downloaded remotely via Bluetooth, but den boxes had to be opened once every two years to replace temperature logger batteries. The only exceptions to continuous monitoring occurred if remote camera or temperature logger batteries died or memory filled up in between monitoring visits.
Identifying temperature changes in den boxes
Normal daily oscillations in den box and cavity temperature caused by changes in ambient weather occur relatively slowly, while changes in temperature from animal occupancy should occur rapidly (Coombs et al. 2010, Velander et al. 2023). Sudden directional shifts in temperature would result in a distinguishably high rate of change over time relative to normal daily oscillations. We used two rate of change equations to help distinguish sudden changes in internal temperature from normal daily oscillations in temperature. Equation 1 calculates the difference in temperature over
time:

Equation 1.
where Ri is the rate of change in cavity temperature with respect to time (T/t) at time step i, Ti+1 is the temperature at the next time step, Ti-1 is the temperature at the previous time step, ti+1 is the time at the next time interval and ti-1 is the time at the previous time interval. R is the first derivative of temperature (T) with respect to time.
Equation 2 calculates the difference in R over time:

Equation 2.
where Zi is the second derivative of temperature (T) and the first derivative of the rate of change (R) with respect to time (T/t2), at time step i. Ri+1 is the rate at the next time step, Ri-1 is the rate at the previous time step, ti+1 is the time at the next time interval and ti-1 is the time at the previous time interval. Equation 2 minimizes variability in R over time, which further helps distinguish sudden changes in temperature.
Using measured temperatures from each den box, we calculated R (Eq. 1, difference in temperature over time) and Z (Eq. 2, difference in R over time) values at each time step. Our initial temperature dataset was large (52,885 days), so manually identifying sudden changes in temperature was time consuming. We used a threshold of Z to identify time steps that showed a potential use by an animal to save time by focusing on periods likely to have corresponded to animal uses. We summarized the maximum absolute Z-value for periods that did not include any apparent uses by animals. We then multiplied this value by two to establish a threshold that would be used to define Z-values that were higher or lower than expected and flagged any Z-values with an absolute value above this threshold as potential uses that required manual inspection. Manual inspection of these flagged time steps and preliminary analysis revealed that this method tended to overestimate the number of occurrences where a sudden change in temperature was caused by an animal. Specifically, this method flagged 404 potential temperature change events. However, only 224 appeared to have legitimate changes in temperature and temperature rate of change after manual inspection. Although these false positives added time to our evaluation, this filtering method reduced the effort required to manually inspect temperature and temperature rate of change data.
Data analysis
We performed three separate sets of analyses to address our objectives. We performed all analyses in R (R Core Team 2021; Version 4.1.1). First, we described the overall patterns in temperature and temperature rate of change (R and Z values) when an animal uses a den box. Second, we compared temperature and remote camera data to test whether temperature data could distinguish known uses identified by remote cameras. For all potential uses identified by our threshold-based filter, we visually evaluated the overall pattern to determine whether it matched the pattern we described using known uses. Additionally, we determined whether camera data demonstrated presence of an animal at or within the den box during periods of abnormal temperature fluctuation identified by our threshold-based filter. After evaluating all potential uses, we calculated what proportion of camera-detected fisher and marten den box uses and known squirrel events were detected using temperature data and rates of change. Further, we evaluated whether there were instances where remote cameras failed to detect a den box use based on temperature and rates of change. We were also interested in evaluating whether time of year influenced temperature-based detection of animals within den boxes. Preliminary analyses demonstrated that fisher, marten, and squirrel uses were not distributed evenly across time, limiting our ability to rigorously test for month- or season-based variation in temperature-based detections. Consequently, we simply described the number of uses detected by species, month, and detection method (camera, temperature logger, or both).
Third, we tested whether temperature logger data could be used to distinguish uses by fishers from uses by martens. For this analysis, we calculated the maximum amplitude, which we defined as the maximum absolute value of Z-values calculated during each known fisher and marten use. We tested for differences in amplitude between the two species using Student’s t-test. Our data did not meet normality assumptions, so we conducted a t-test using both log-transformed and non-transformed data. Tests using transformed and non-transformed had the same statistical significance, so we reported the results of the t-test using non-transformed data. We also fit a simple logistic model to determine how maximum amplitude influenced the probability that the animal using the den box was a fisher (y = 1) with marten uses as the null result (y = 0). We used z-scores to determine whether the effect of maximum amplitude was statistically significant. We evaluated how well our logistic regression model distinguished between fisher and marten den box uses by calculating the area under the curve (AUC) for the receiver operating characteristic (ROC) curve using the ‘ROCR’ package (Sing et al., 2005) in Program R.
There was an unequal amount of sampling days for cameras (133,126 days sampled) and temperature loggers (52,885 days sampled), largely caused by temperature logger batteries failing before they were replaced. For our analyses, we only used data from days when both cameras and temperature loggers were operating.
Results
We installed den boxes between March 2018 and February 2020, with monitoring occurring continuously through November 2023. Of the 96 den boxes that were installed, 86 had sufficient data for analysis.
Patterns of temperature and temperature rate of change during animal uses
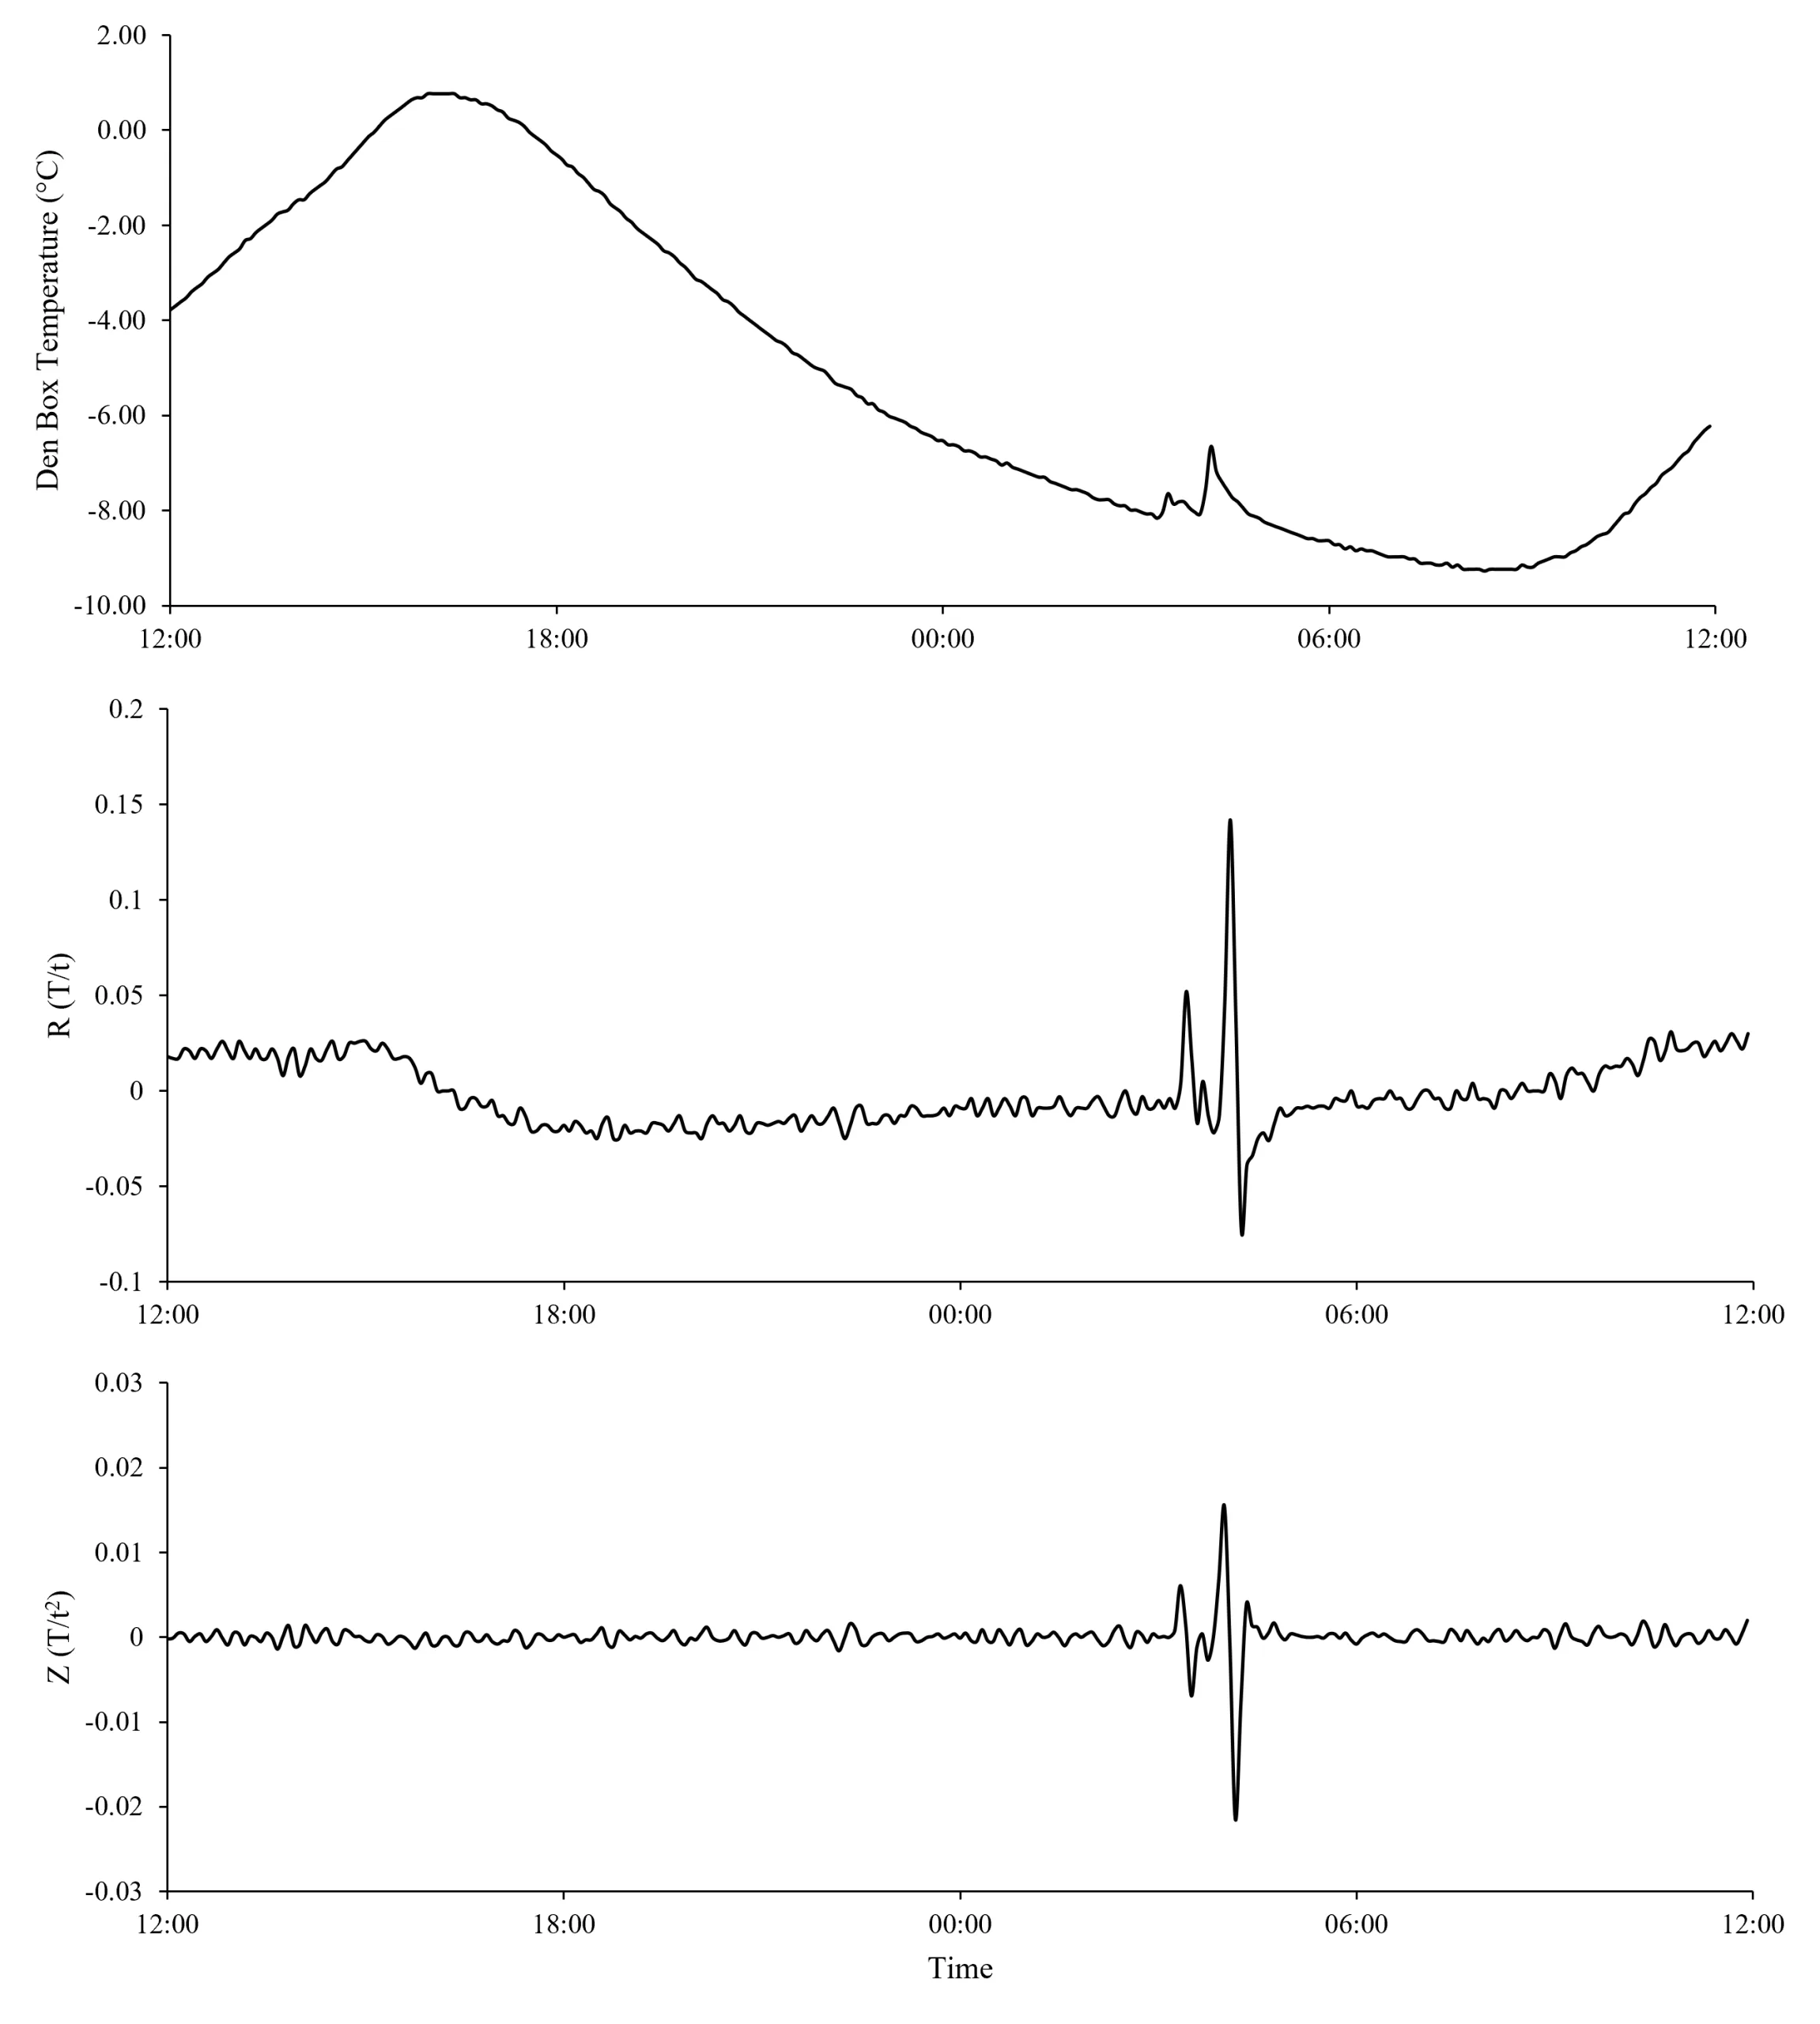
Fishers and martens entering and occupying den boxes caused characteristic changes in internal den box temperature and temperature rate of change (R and Z values) that were consistent and distinguishable from background den box temperature patterns (Figures 1 and 2). Prior to use by an animal, den box temperature followed a pattern of smooth oscillations (Figures 1a and 2a) with R and Z values being relatively stable and close to 0 (Figures 1b,c and 2b,c). Z-values were less variable than R-values (Figures 1c and 2c). Upon entering and presumably laying down in the den box, body heat from fishers and martens caused a sudden increase in temperature that resulted in a positive spike in R and Z. While an animal remained in the box, temperature stabilized at a warmer temperature than if the box was unoccupied; however, temperatures did occasionally fluctuate due to apparent movements of the animal while using the den box. The stabilization of den box temperature with animal presence resulted in R– and Z-values approaching zero, while the occasional fluctuations in den box temperature from apparent movement of resting animals caused R– and Z-values to display rapid directional shifts (Figures 1 and 2). When a fisher or marten left the den box, the temperature inside would return to its normal pattern of smooth oscillations, and R and Z values demonstrated a relatively large, negative spike which would return to zero as the temperature of the box approached its normal pattern of temperature fluctuations. The pattern of 1) initial positive spikes in R– and Z-values, 2) temperature variability, fluctuations, 3) sign changes of R– and Z-values, and 4) events ending with a terminal negative spike was consistent for all fisher and marten uses detected from photographs.
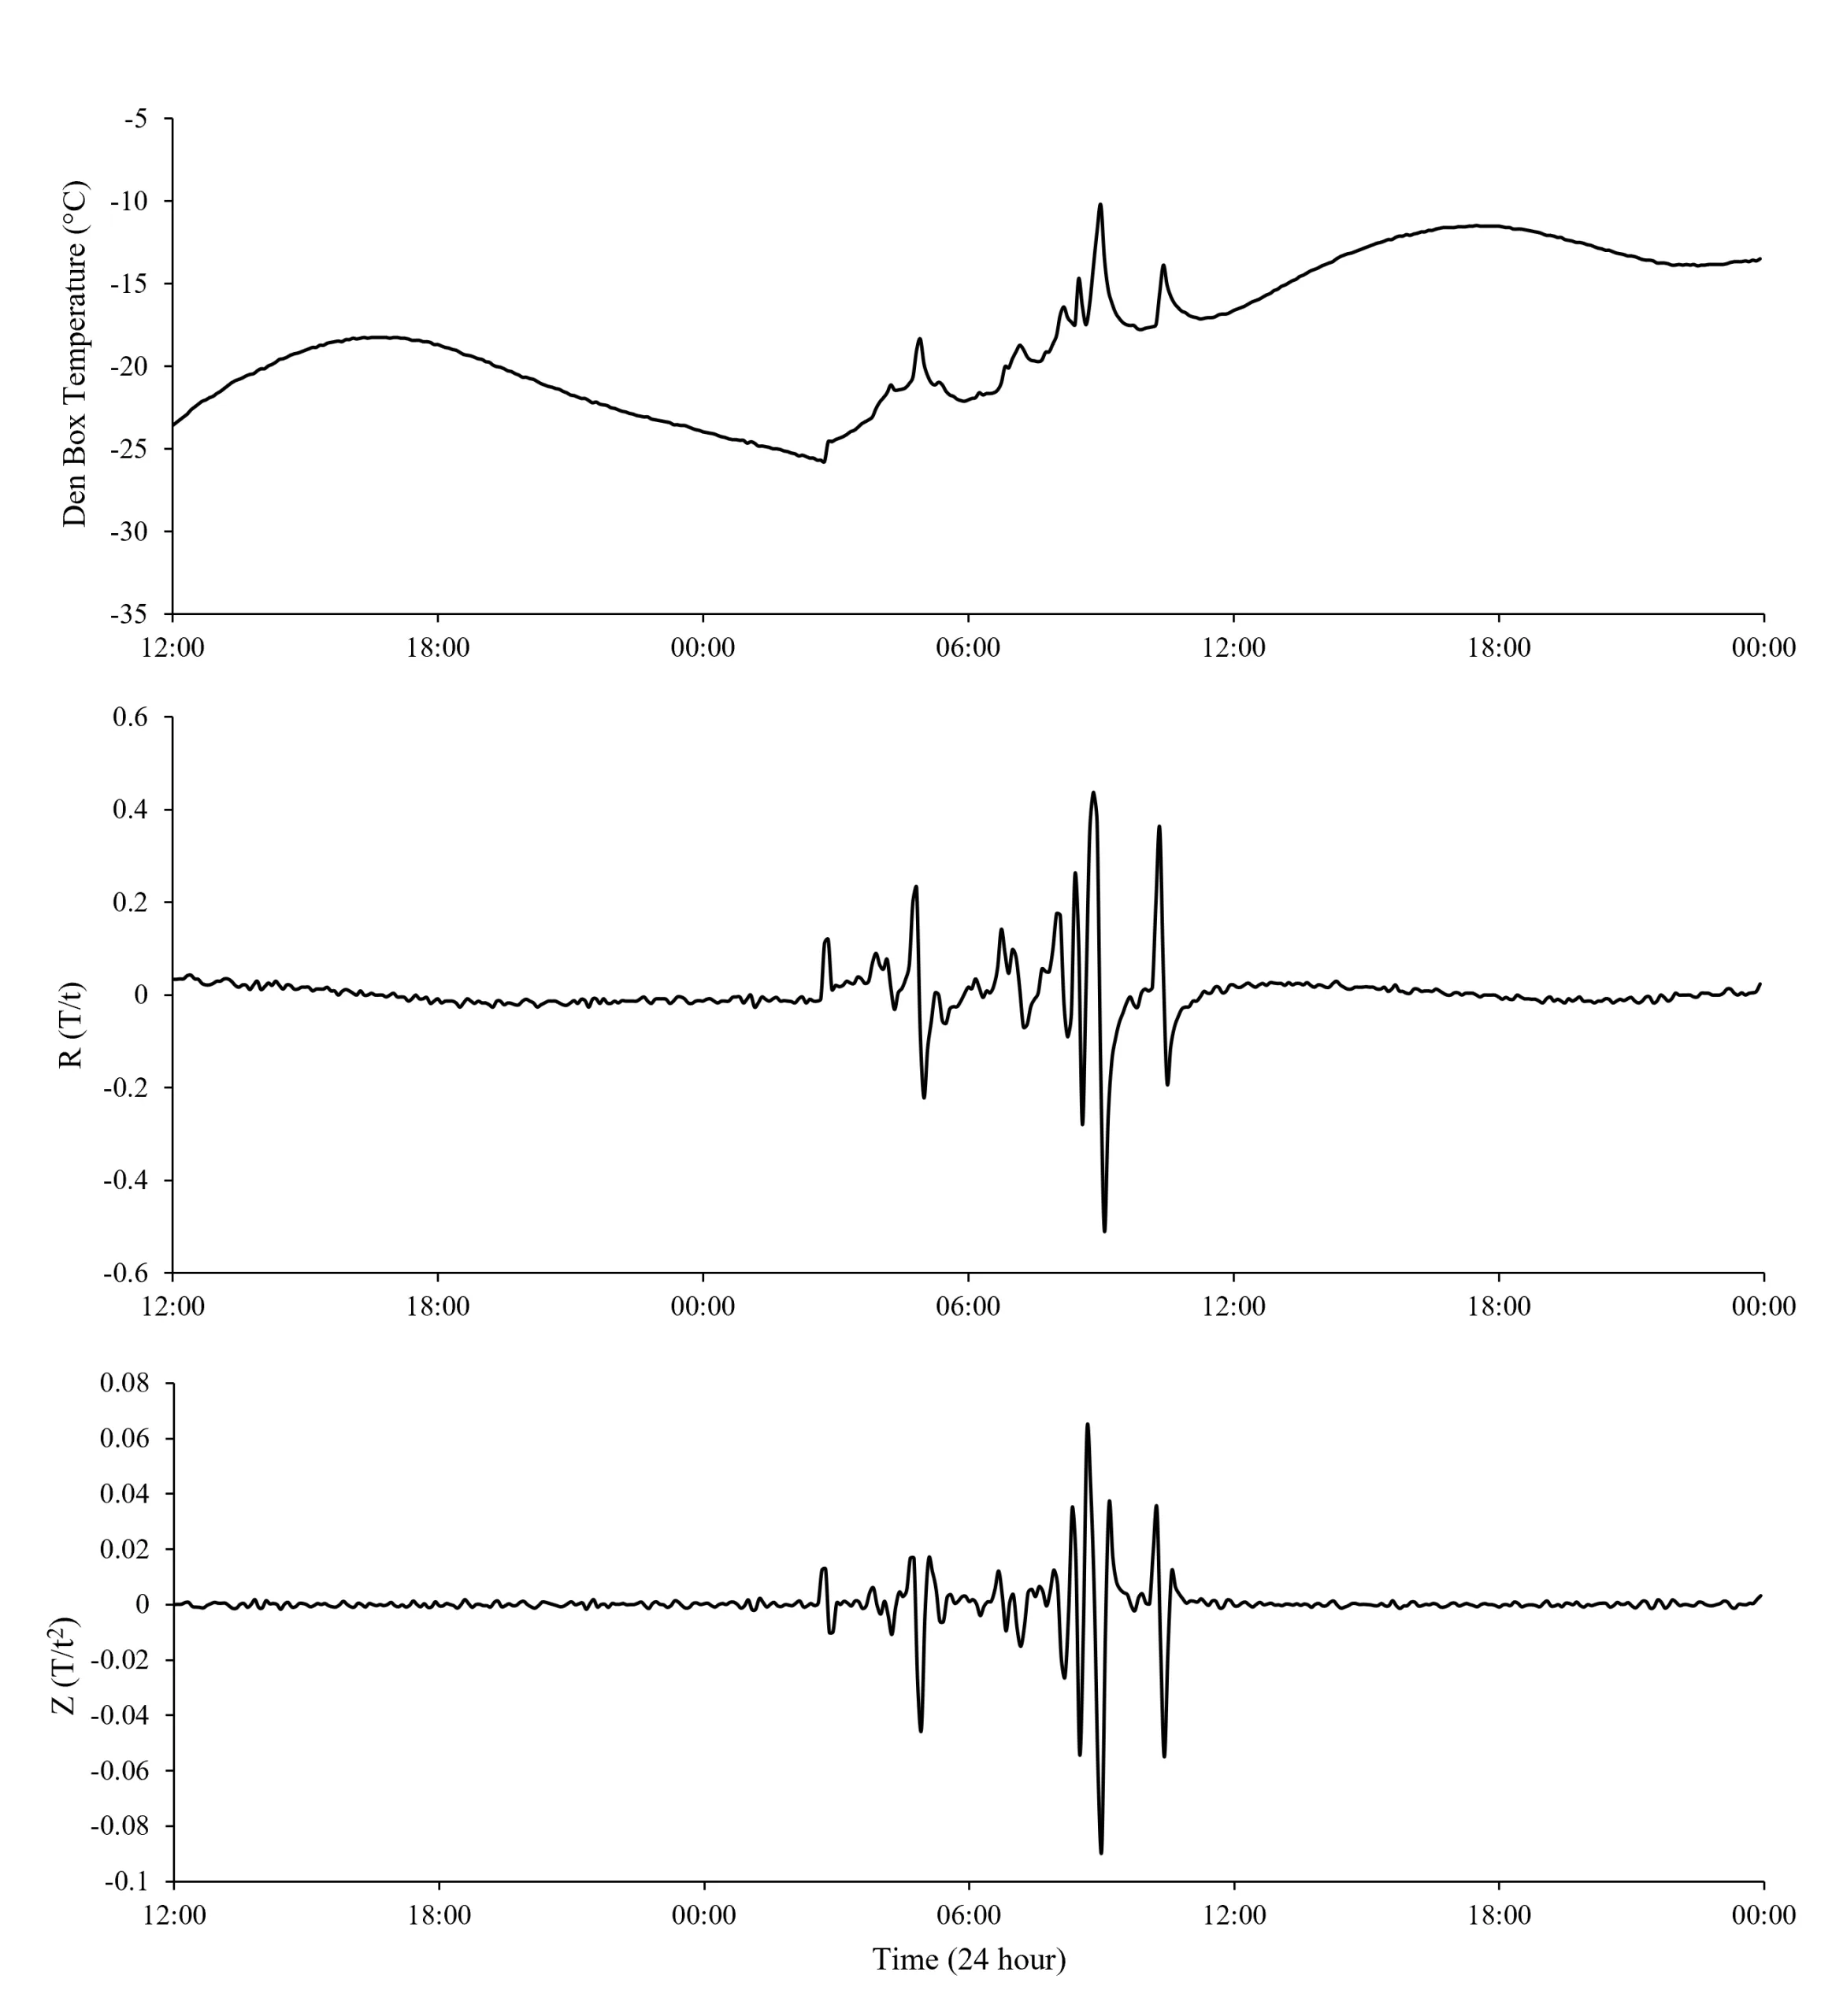
Figure 1. An example of den box temperature (a) and its first (R-value; b) and second (Z-value; c) derivative with respect to time before, during, and after a known fisher use. Dashed vertical lines represent the beginning and end of the fisher use based on remote camera images. Data displayed are from 27-28 January 2021.
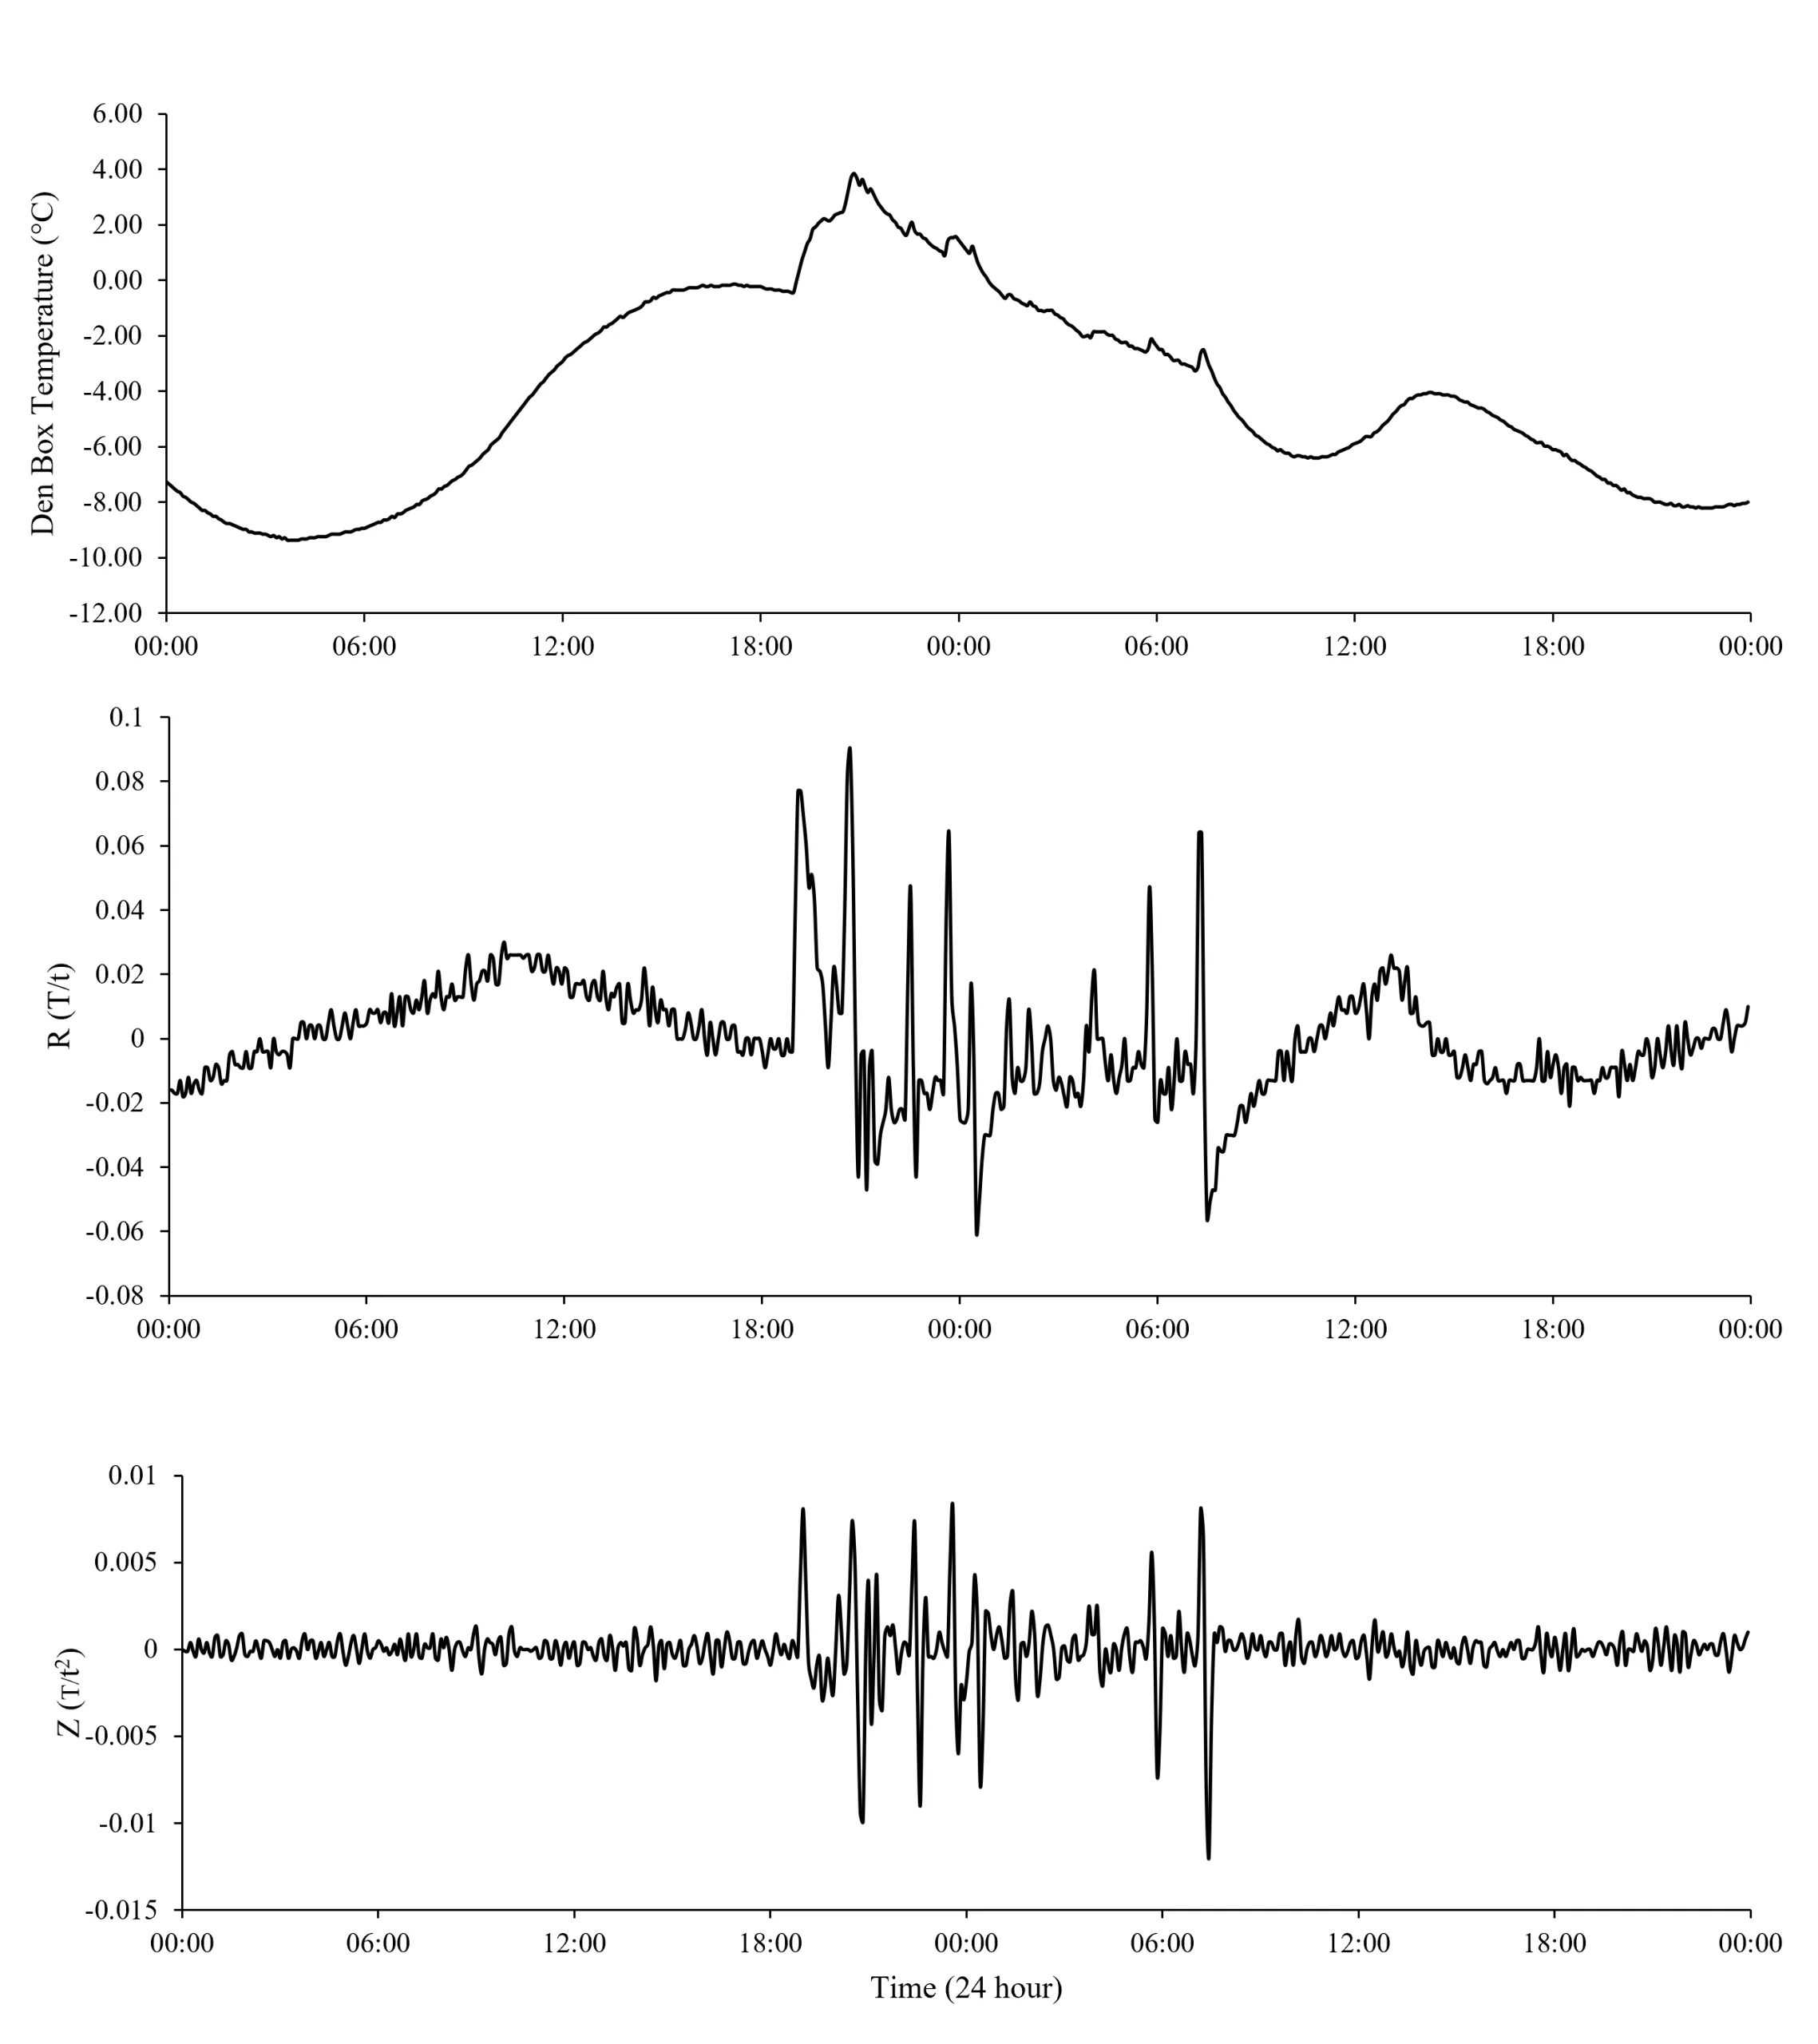
Figure 2. Den box temperature (a) and its first (R-value; b) and second (Z-value; c) derivative with respect to time before, during, and after a known marten use. Dashed vertical lines represent the beginning and end of the marten use based on remote camera images. Data displayed are from 22-23 November 2020.
Evaluating how well temperature loggers documented den box use
Remote cameras captured a total of 329 uses or visits by fishers (20 uses, 87 visits) and American martens (13 uses, 209 visits) across all den boxes (Tables 1 and 2). All the den box uses by fishers and martens detected by remote cameras followed the temperature pattern described above (Figures 1 and 2) and were, therefore, detected using temperature data (Table 1). Of the 87 fisher visits and 209 marten visits identified by cameras, most (56 fisher visits, 185 marten visits; Table 2) did not have any temperature pattern associated with them. For the majority of camera-detected visits, animals were not observed entering boxes (e.g., they were only seen on or near the box), so no temperature change was expected. We observed sudden den box temperature changes for 31 camera-detected fisher visits and 24 camera-detected marten visits (Table 2). For most of these camera-detected visits (23 fisher visits and 19 marten visits), changes in den box temperature and rate of temperature change lasted for less than 30 minutes, indicating short-term occupation of den boxes (Table 2). These often corresponded to instances of animals clearly entering den boxes on camera images, as well as instances of them carrying prey into den boxes. For a small number of camera-identified visits (8 fisher events, 5 marten events), den box temperature change data documented presence for 30 minutes or longer, indicating that these camera-identified visits corresponded to fishers and martens using den boxes (Table 2). In total, we identified 28 fisher uses and 18 marten uses from a combination of remote cameras and temperature loggers (Table 1).
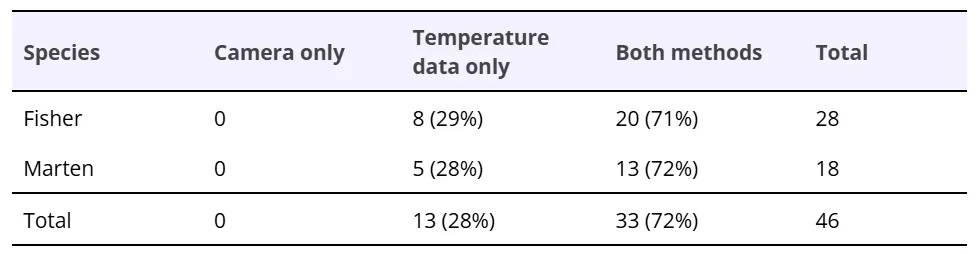
Table 1. Comparison of detection of den box uses by fishers and American martens using remote cameras only, temperature loggers only, and both methods. Uses correspond to animals entering and remaining in den boxes for at least 30 minutes.
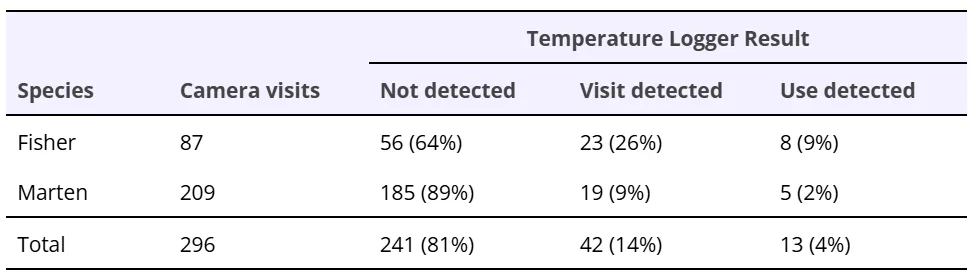
Table 2. Summary of temperature change patterns detected for fisher and American marten den box visits identified from remote camera data. Camera visits is the number of visits identified by remote cameras. Temperature logger detections were classified as visits (<30 minute) or uses (≥30 minutes) depending on how long temperature patterns indicating occupancy persisted.
Den box uses by fishers and martens occurred in multiple months but uses were not distributed evenly across the year (Figure 3). Because we detected all known fisher and marten den box uses using the temperature rate of change method, temporal variation appears to have resulted from variation in den box use patterns. Fisher uses occurred most frequently in September and January, but also occurred in 6 other months (Figure 3). American marten uses occurred most frequently in March, April, and September, but also occurred in 5 other months (Figure 3). Collectively, we detected uses by these species in 11 of 12 months, suggesting that seasonal variation in ambient temperature conditions did not affect our ability to identify den box uses with temperature loggers.
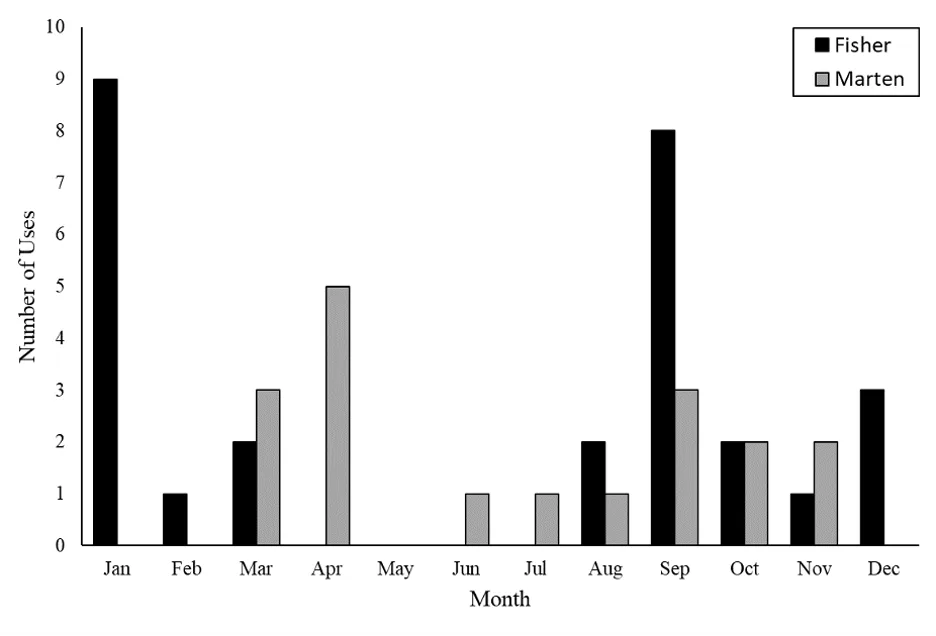
Figure 3. Histogram showing the distribution of den box uses by fishers (black bars) and American martens (gray bars) by month. The graph shows all uses detected using temperature loggers, including those that were not detected using remote camera data alone. Collectively, uses were detected in 11 out of 12 months of the year.
Cameras also captured a total of 5399 events from red squirrels (1604 events), gray squirrels (762 events), and flying squirrels (2782 events). There was a change in den box temperature, consistent with patterns identified for martens and fishers, for 0.3%, 3.5%, and 1.2% of red squirrel, gray squirrel, and flying squirrel events, respectively (Figure 4). It was difficult to distinguish visits and uses of squirrels from camera data (i.e., it was easy to detect squirrels but difficult to determine whether they entered and remained in den boxes; most images showed these species on top of the box, even when we independently confirmed use during monitoring visits), making it impractical to evaluate how frequently temperature loggers identified squirrel uses. Consequently, we were unable to compare uses detected by cameras to those detected by temperature loggers.
We also identified 83 instances where there was a sudden change in temperature, R, and Z, indicating the presence of an animal inside the den box, but no camera images were taken of an animal entering or leaving the box. Sometimes, this occurred when snow was covering the camera lens, and the camera was triggered to take images at the beginning and end of the putative animal use. In other cases, no images were taken despite there being no clear reason why the camera would not have functioned. As an example of when temperature change data and camera data were not consistent, at one den box with two camera-verified uses by a fisher, there were two putative uses that were not documented by cameras (Figure 5). In this box, there were no images taken of an animal using the box during the first period of temperature change, the second and third periods were classified correctly as fisher uses with camera data, and the fourth period was classified as a visit based on images of fishers outside of the box, but there was a temperature change that lasted for 45 minutes (Figure 5). Although these temperature patterns all strongly suggest use by fishers and martens, we did not classify them as such here unless we could independently verify fisher or marten presence at the den box using cameras.
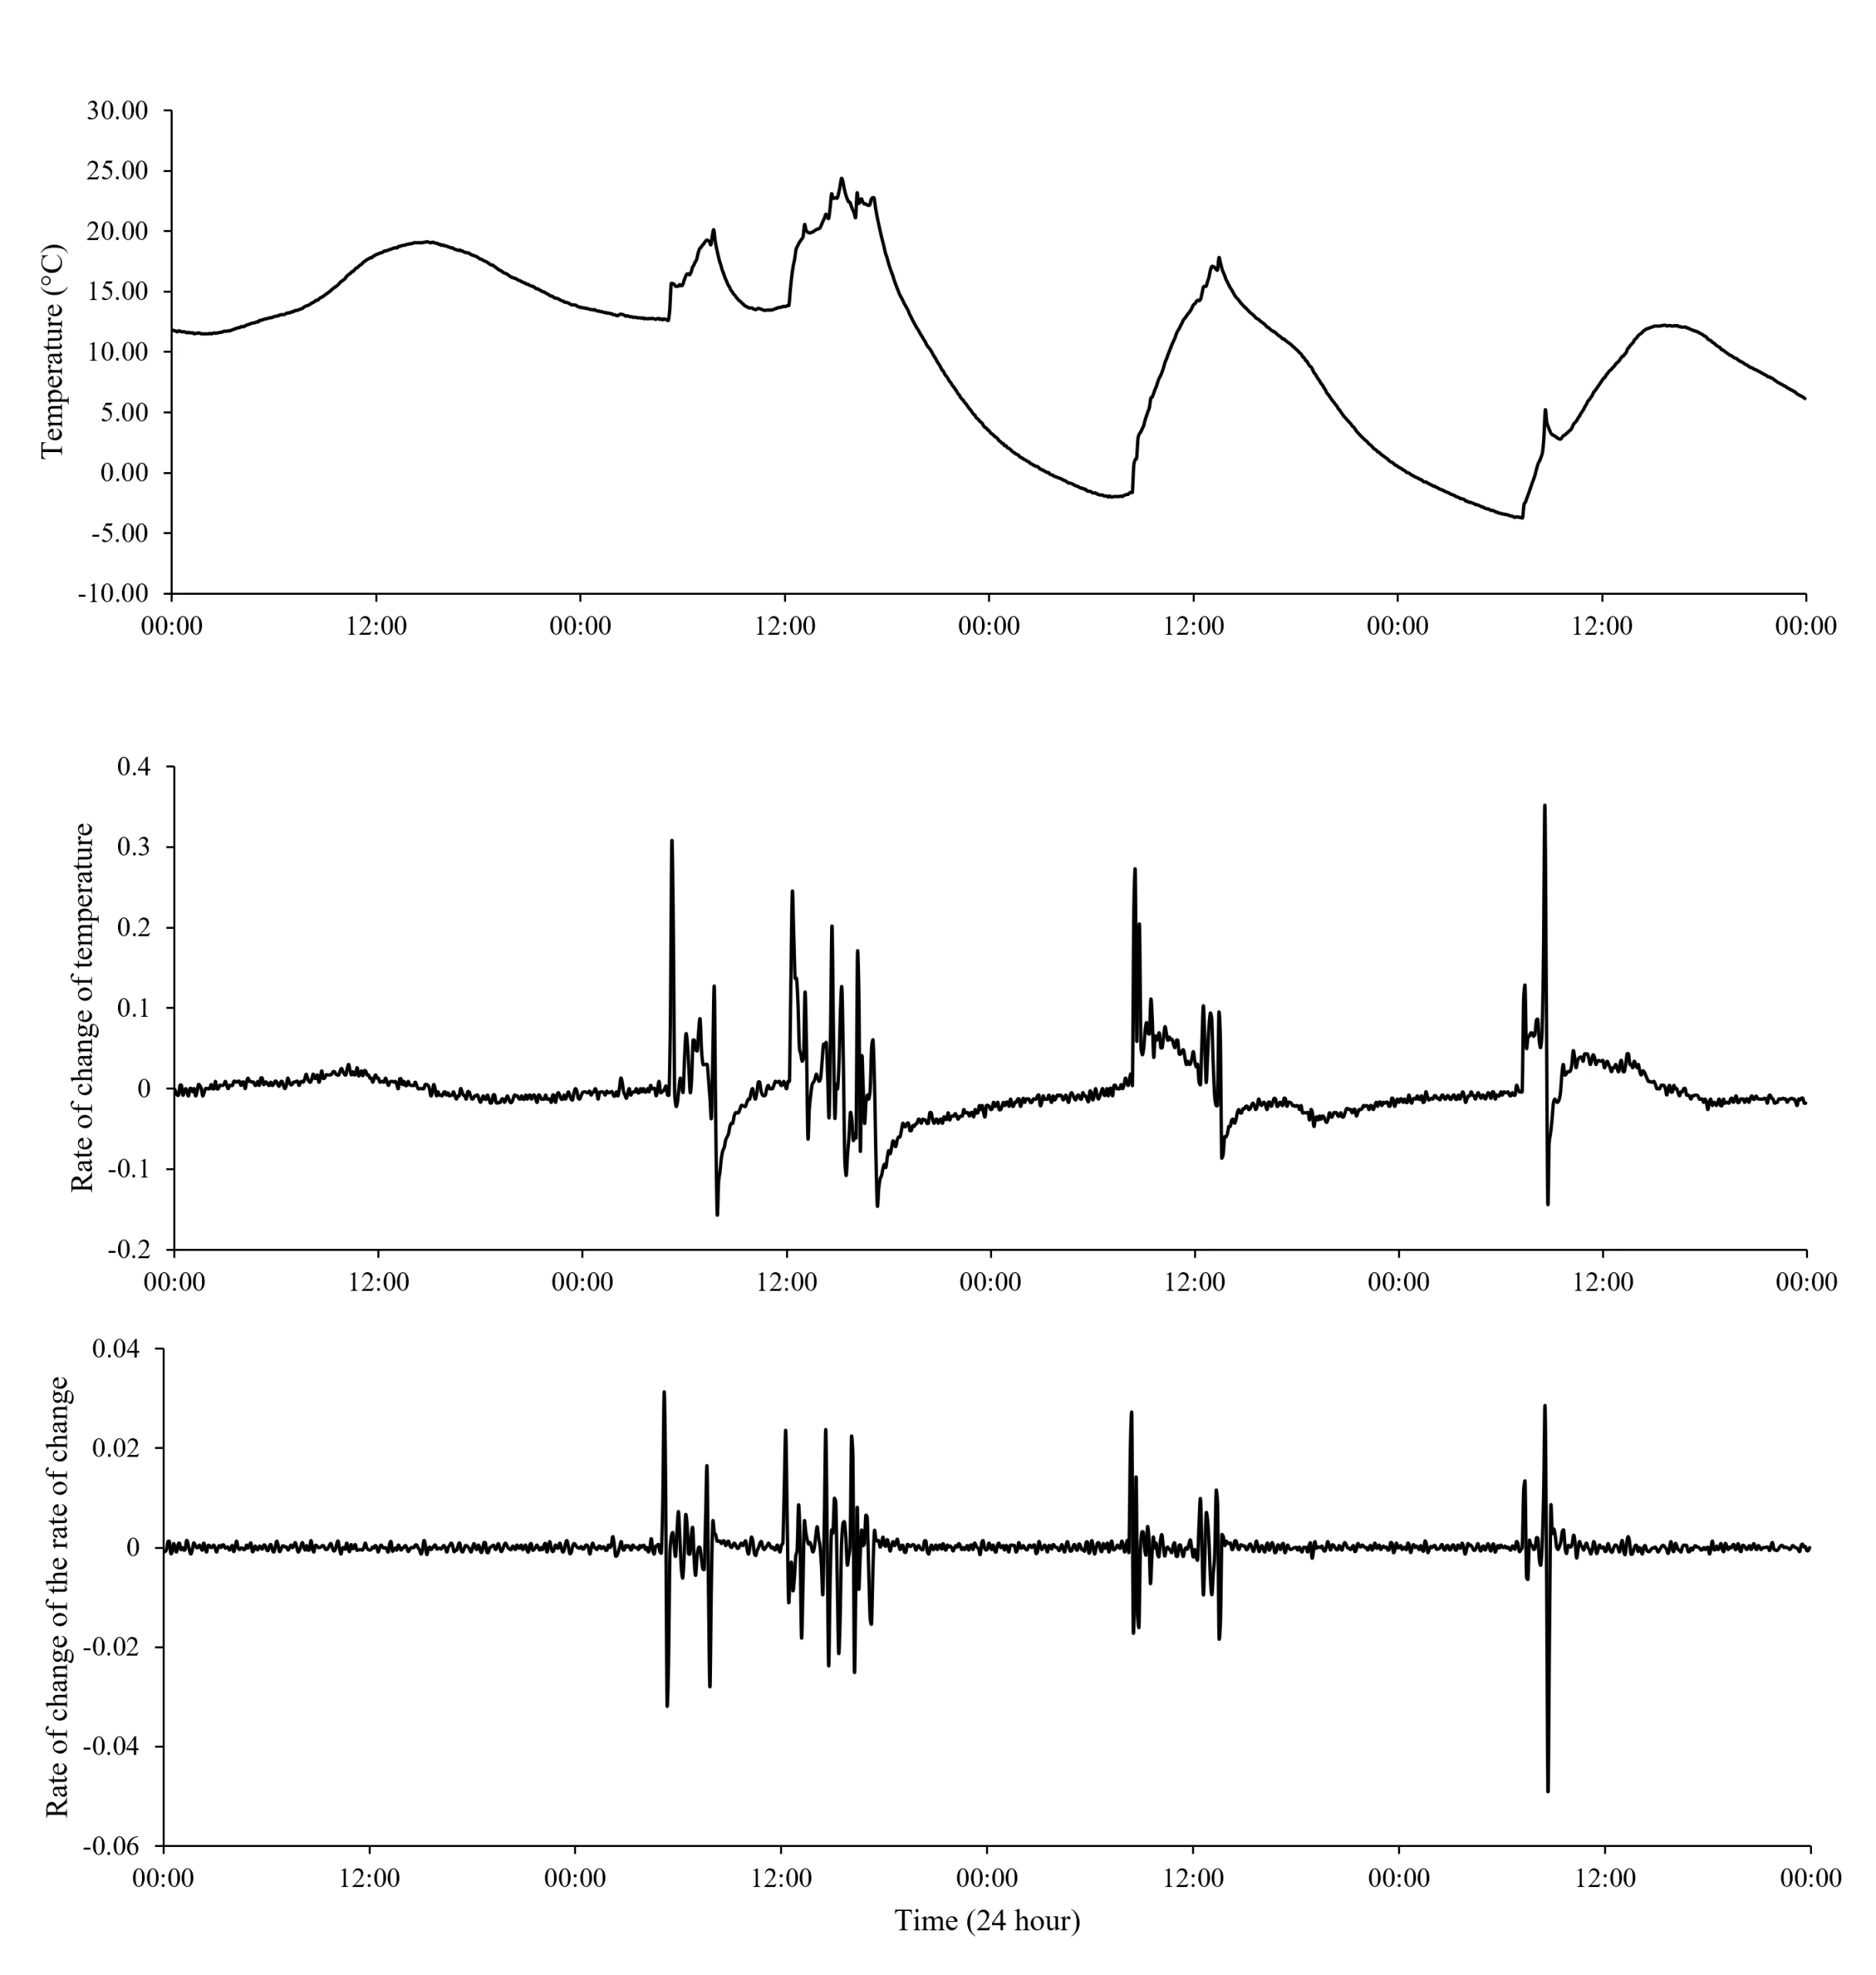
Figure 5. Den box temperature (a) and its first (R-value; b) and second (Z-value; c) derivative with respect to time before, during, and after four den box uses. Dashed vertical lines represent the beginning and end of animal uses across four occasions. Data displayed are from 15-18 September 2020, when a fisher was documented using the den box two times (uses 2 and 3 in panel A) and suspected of using it two additional times (uses 1 and 4 in panel A; note: camera images verified presence of a fisher at the beginning of putative use 4).
Distinguishing species using temperature rate of change
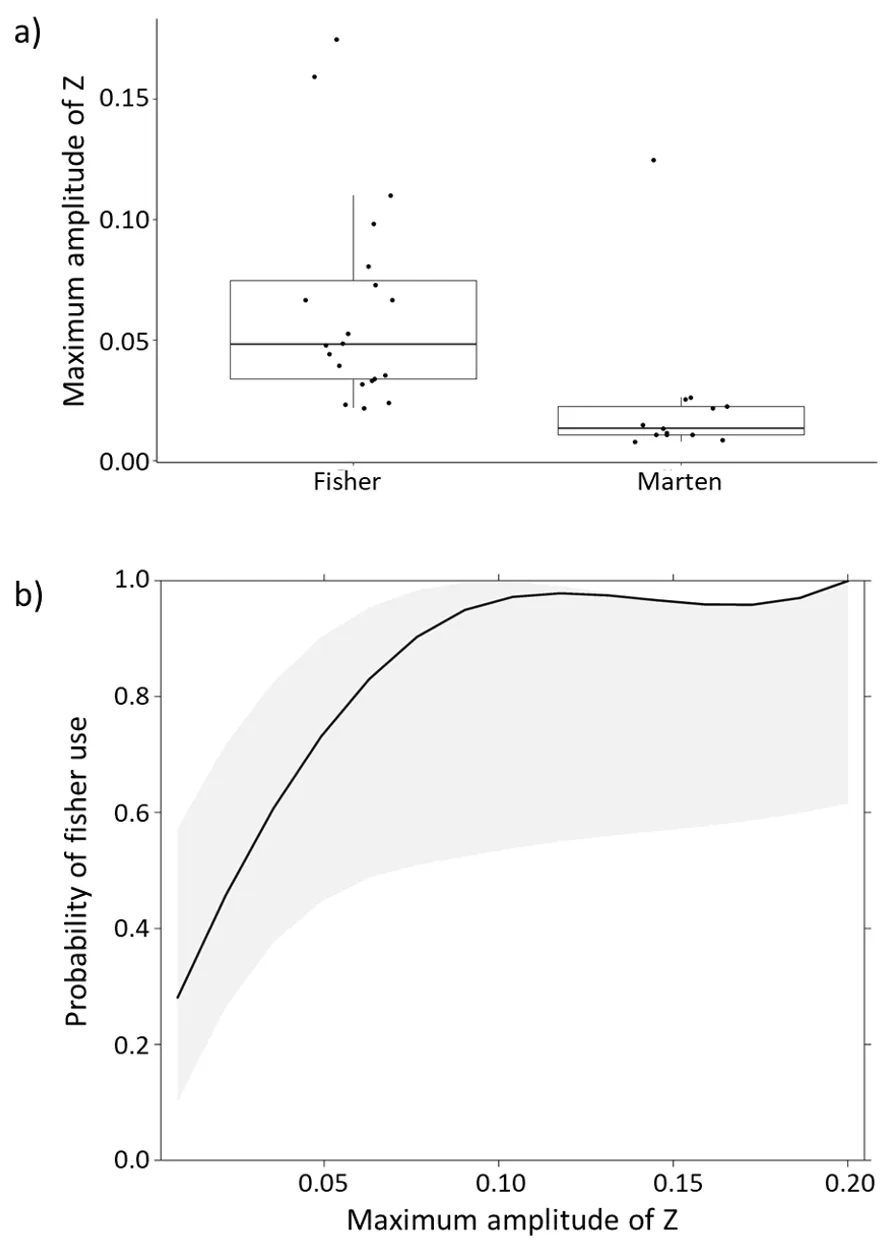
The maximum amplitude of Z during known fisher uses (mean = 0.04, SD = 0.03, range = 0.01 to 0.10) was significantly higher (t30 = 2.8, p = 0.01) than marten uses (mean = 0.01, SD = 0.02, range = 0.004 to 0.07), although the variability and range of amplitude values was higher for fisher uses than for marten uses (Figure 6a).
The probability that the animal using the box was a fisher increased with increasing amplitude (Figure 6b, Log-odds ratio = 84.8, Z = 2.08, P = 0.037; the log-odds is large because of the scale of the explanatory variable). When amplitude was greater than 0.05, there was a ≥90% probability that the animal using the box was a fisher (Figure 6b). When amplitude was less than 0.015, there was a ≥50% chance that the animal using the box was a marten (Figure 6b). AUC for the logistic regression model was 0.90, indicating good discrimination.
Discussion
Our results demonstrated that temperature rate of change was able to accurately identify den box use by American martens and fishers. We found that uses followed a consistent pattern of temperature rate of change over time that could also be used to distinguish uses by fishers from uses by martens with a high degree of certainty. Additionally, our results show that the metric of temperature rate of change improves the ability to detect use by animals compared to temperature alone. Equations 1 and 2 provide a more consistently detectable signal because values are close to zero when den boxes are unoccupied, masking the background daily oscillations in den box temperature.
Our results are consistent with past studies and highlight the value of using temperature loggers to monitor den box use as part of den box programs aimed at conservation and research on cavity-dependent wildlife (Cawthen et al. 2009, Moore et al. 2010, Smaal and van Manen 2017). Although den boxes can be used for multiple research and management goals, evaluating the success of objectives typically relies on some measure of den box use or visits by target and non-target wildlife (Harper et al. 2005, Lindenmayer et al. 2009, Moore et al. 2010, Goldingay 2017). We found that temperature loggers were more sensitive than remote cameras, identifying den box uses that were not apparent from remote cameras alone. The inability of remote cameras to document these uses was due to imperfect detection by remote cameras, which was likely caused by distance between the camera and box, misalignment between the sensor and animal location, and other confounding factors (e.g., snow obscuring the lens or sensors). Temperature data also allowed us to occasionally identify the presence of fishers and martens within den boxes even when they did not remain in the box for 30 minutes (e.g., when caching or consuming prey). Similarly, Smaal and van Manen (2017) observed short term fluctuations in den box temperature of a smaller magnitude than those corresponding to uses by weasels. They hypothesized that smaller temperature fluctuations could have indicated the presence of mice, voles, or weasels, but were unable to verify this. The sensitivity of temperature loggers to animal presence is of particular value for documenting whether den boxes are used, as well as for characterizing temporal patterns and intensity of use. Nonetheless, in some cases den boxes are used to monitor for species presence (e.g., Ford et al. 2015), and temperature loggers alone will not be able to identify presence of animals that do not enter the den box.
Other studies using temperature loggers to monitor den box use have typically relied on pairs of temperature loggers to simultaneously monitor internal and ambient temperatures and developed methods that compare den box temperature to ambient temperature to identify animal uses (Cawthen et al. 2009, Moore et al. 2010). By using temperature rate of change, we were able to identify den box uses with a single temperature logger per den box, reducing monitoring costs by requiring half as many temperature loggers. Alternatively, if an external temperature logger was used at a den box, comparing the difference in R and Z values between the two temperature loggers might be a more sensitive test of den box occupancy. This method could be used on previously collected data sets to evaluate past box use (Cawthen et al. 2009, Moore et al. 2010).
Den box temperature changed more rapidly when occupied by fishers than when occupied by martens, suggesting that temperature rate of change is a useful metric for identifying the species corresponding to a use event. Past studies have not attempted to identify species from temperature loggers alone (Cawthen et al. 2009, Moore et al. 2010, Smaal and van Manen 2017), making this result an important improvement for the type of data that temperature loggers could provide to researchers. Species identification from temperature logger data alone may be possible if two conditions are met. First, species-specific temperature patterns would need to be determined using remote cameras or other observational methods to link temperature change patterns to individual species. Second, different species need to have distinct temperature change patterns. The temperature rate of change pattern from individual species likely depends on placement of the temperature logger, and the body size of animals that could potentially use (i.e., fit inside of) den boxes, both in absolute terms and relative to the size of the den box interior. We intentionally placed internal temperature loggers on the side of den boxes above bedding material so that martens and squirrels using den boxes would not make direct contact with temperature loggers, while fishers would. Additionally, fishers are larger and lose a greater absolute amount of heat, and both temperature logger placement and total heat loss likely contribute to the differences in temperature change patterns that we observed. When potential den box users are small relative to den box interiors or there are many species that could occupy den boxes, species identification may not be possible from temperature rate of change data alone. In our study area, there were few species that could have fit inside and used den boxes, which likely aided our ability to distinguish fishers and martens using den boxes. Nonetheless, fisher and marten body size varies across their range (e.g., Green et al. 2018), and this method may not distinguish fisher and marten uses as well in areas where their relative size differences are reduced.
Although our method was successful at identifying uses by fishers and martens, we were unable to reliably identify uses by tree squirrels. In several instances, we detected similar temperature patterns seen with fisher and marten use from squirrel use, which demonstrates the consistency of the temperature pattern corresponding to den box use. Flying squirrels and red squirrels are smaller than martens and give off less heat, which could limit their detection from temperature loggers unless multiple individuals huddled in a box at the same time. Gray squirrels, however, are similar in size to martens, suggesting that body size alone does not explain the low detectability of tree squirrels. Instead, the lack of detection may relate to the behavior of animals using den boxes. Flying squirrels tended to nest within the bedding material when using den boxes, which would have reduced the rate of heat loss to the den box environment and temperature logger. Gray squirrels and red squirrels often brought additional nesting material (e.g., leaves, sticks) into the den boxes. Nesting material partially covered and insulated temperature loggers, likely preventing the rapid temperature change characteristic of fisher and marten uses, both of which do not bring additional bedding material to the den box. Box size and configuration likely influences the ability to detect species, and projects specifically interested in identifying use by smaller species such as squirrels would likely benefit from smaller boxes where the heat of these smaller species could accumulate and allow for their detection from temperature data.
We were able to detect fisher and marten use in most months of the year using temperature loggers, demonstrating that our method was not affected by seasonal changes in the thermal environment or animal pelage. During winter, mammals have characteristic changes to their pelts that improve insulation and reduce heat loss (e.g., growing longer hair; Marchand 2014), thereby reducing heat transfer to the den box interior. At the same time, the temperature differential between the den box and animal body would increase, which would increase heat loss (Marchand 2014). During summer, insulation from the pelage and temperature differential are both lower. Our ability to detect fisher and marten occupancy in both seasons suggests that these changing effects offset. Whether this remains true in tropical or subtropical climates requires further investigation.
One critical objective in many den box projects is providing reproductive habitat for species that rely heavily on tree cavities for parturition and rearing of young, as well as using den boxes to estimate critical reproductive parameters (e.g., Davis and Horley 2015, Croose et al. 2016, Goldingay 2017, Fay et al. 2019). Although we did not observe fisher or marten parturition in any den boxes, temperature loggers should detect initial occupancy and provide information on date and time of reproductive den establishment. Further, neonates are small and may thus add relatively limited heat to den boxes right after parturition, which could allow temperature loggers to detect den attendance patterns as the female leaves and returns to the den box. As offspring grow, with large litter sizes, or for species in which both parents take turns incubating eggs or tending to neonates, the constant heat from box occupants could obscure temperature patterns related to adult den attendance patterns but may still accurately document the period of den box occupancy. Additional data are needed to evaluate temperature change patterns in den boxes used for reproduction.
Temperature loggers have several benefits that make them a valuable tool for monitoring den boxes. Temperature loggers are cheaper to purchase and maintain than remote cameras. For example, the temperature loggers we used cost ~$50 USD per logger compared to $150 USD per camera. When recording temperatures every 5 minutes, the temperature loggers we used took ~13 months to fill available memory, while a single battery lasted ~2 years. Our remote cameras had to be checked 3 or more times a year to change memory cards and replace batteries to keep them operational. Analysis time for temperature data is also substantially less, as manual inspection often took about 30 minutes or less to analyze an entire year of temperature data compared to several hours to several days to analyze camera images recorded over an entire year from a single box depending on the number of images recorded. Thus, using temperature loggers as the primary means of monitoring den boxes could save considerable time and money. Although not tested here, temperature loggers and temperature rate of change could likely also provide accurate, cost-effective monitoring of natural cavities (Cawthen et al. 2009).
Choice of den box monitoring methods should ultimately depend on project objectives. Temperature loggers alone may be sufficient for monitoring den boxes when researchers are primarily interested in occupancy rates irrespective of species or when species identification is possible from temperature logger data. Alternatively, pairing temperature loggers with remote cameras or other methods (e.g., hair snares; Davis and Horley 2015) would provide more complete data when researchers are interested in documenting presence outside of boxes, when species identification is not possible from temperature data alone, or when researchers are interested in further evaluating the methods presented in this paper. When cameras are only available to monitor a subset of den boxes, temperature loggers could be used to prioritize which boxes receive camera monitoring. Additionally, pairing both methods could reduce overall analysis time if temperature data were used to identify times corresponding to uses, thereby allowing researchers to focus their analysis of remote camera images to times when den boxes were known to be used.
Our results highlight several important avenues for future research on den box monitoring methods. Future studies could evaluate how temperature logging interval affects the ability to detect den box use or species identification. We primarily used a 5-minute temperature logging interval, which appeared to be sufficient for detecting uses by fishers and martens. Less frequent sample intervals could make it more challenging to detect animal presence and reduce how precisely the duration of den box use could be estimated. Further studies are also needed to test how generalizable our methods are by evaluating factors influencing detection (e.g., temperature logger placement) and species identification of animals using den boxes from temperature logger data.
Acknowledgments
S. Johnson helped build fisher den boxes. M. Swingen, R. Olesiak, B. Prange, and R. Pennesi helped install and monitor den boxes. L. Hall, K. Patronik, R. Peer, R. Siebers, and N. Weisenbeck helped monitor den boxes and analyze remote camera images. We appreciate the constructive feedback provided by 5 reviewers that greatly improved this manuscript.
Author Contributions
Michael J. Joyce: conceived and designed the analysis, collected data, contributed to data analysis, wrote the paper
Taylor B. Velander: method development, conceived and designed the analysis, collected data, performed the analysis, wrote the paper
Michael C. McMahon: collected data, analyzed remote camera data, discussed results and contributed to the final manuscript
Ron A. Moen: contributed to data analysis, discussed results and contributed to the final manuscript.
Data Availability
All data and code are available here.
Transparent Peer Review
Results from the Transparent Peer Review can be found here.
Recommended Citation
Joyce, M.J., Velander, T.B., McMahon, M.C., & Moen, R.A. (2025). Using temperature loggers to monitor den box use by American martens, fishers, and tree squirrels. Stacks Journal: 25003. https://doi.org/10.60102/stacks-25003
References
Althoff, D. P., & Althoff, P. S. 2001. Monitoring southern flying squirrel populations with nest boxes. The Ohio Journal of Science 101: 2-11.
Berg, S. S., Erb, J. D., Spaid, V. T., Dewey, D. L., Coy, P. L., Sampson, B. A., Fieberg, J. R., Arnold, T. W., & Forester, J. D. 2020. The role of local cavity tree density in the selection of den sites by female fishers (Pekania pennanti) in northern Minnesota. Canadian Journal of Forest Research 50: 742-750.
Beyer, G. L., & Goldingay, R. L. 2006. The value of nest boxes in the research and management of Australian hollow-using arboreal marsupials. Wildlife Research 33: 161- 174.
Bull, E. L. 1997. Trees and logs important to wildlife in the interior Columbia River basin. Vol. 391. US Department of Agriculture, Forest Service, Pacific Northwest Research Station.
Burger, G. V. 1969. Response of gray squirrels to nest boxes at Remington Farms, Maryland. The Journal of Wildlife Management 33: 796-801.
Carey, A. B. 2002. Response of northern flying squirrels to supplementary dens. Wildlife Society Bulletin 30: 547-556.
Cawthen, L., Munks, S., Richardson, A., & Nicol, S. C. 2009. The use of temperature loggers to monitor tree hollow use by mammals. Ecological Management & Restoration 10: 153- 155.
Cockle, K. L., Martin, K., & Bodrati, A. 2017. Persistence and loss of tree cavities used by birds in the subtropical Atlantic Forest. Forest Ecology and Management 384: 200-207.
Cockle, K. L., Martin, K., & Drever, M. C. 2010. Supply of tree-holes limits nest density of cavity-nesting birds in primary and logged subtropical Atlantic forest. Biological Conservation 143: 2851-2857.
Cockle, K. L., Martin, K., & Wesołowski, T. 2011. Woodpeckers, decay, and the future of cavity‐nesting vertebrate communities worldwide. Frontiers in Ecology and the Environment 9: 377-382.
Coombs, A. B., Bowman, J., & Garroway, C. J. 2010. Thermal properties of tree cavities during winter in a northern hardwood forest. The Journal of Wildlife Management 74: 1875- 1881.
Croose, E., Birks, J. D., & Martin, J. 2016. Den boxes as a tool for pine marten Martes martes conservation and population monitoring in a commercial forest in Scotland. Conservation Evidence 13: 57-61.
Davis, L. R., & Horley, S. 2015. Fisher (Pekania pennanti) artificial reproductive den box study. Unpublished report. Davis Environmental Ltd., Williams Lake, British Columbia, Canada.
Delheimer, M. S., Slauson, K. M., Szykman Gunther, M., & Zielinski, W. J. 2018. Use of artificial cavities by Humboldt marten. Wildlife Society Bulletin 42: 510-517.
Diggins, C. A., Silvis, A., Kelly, C. A., & Ford, W. M. 2017. Home range, den selection and habitat use of Carolina northern flying squirrels (Glaucomys sabrinus coloratus). Wildlife Research 44: 427-437.
Elias, J. M., & Stoleson, S. H. 2021. Abundant Natural Cavities in a Deciduous Forest Leads to a Lack of Nest-Box Occupancy by Northern Saw-Whet Owls. Northeastern Naturalist 28: 202-210.
Fay, R., Michler, S., Laesser, J., & Schaub, M. 2019. Integrated population model reveals that kestrels breeding in nest boxes operate as a source population. Ecography 42(12), 2122-2131.
Ford, W. M., Evans, A. M., Odom, R. H., Rodrigue, J. L., Kelly, C. A., Abaid, N., Diggins, C. A., & Newcomb, D. 2015. Predictive habitat models derived from nest-box occupancy for the endangered Carolina northern flying squirrel in the southern Appalachians. Endangered Species Research 27: 131-140.
Gibbons, P., & Lindenmayer, D. 2002. Tree hollows and wildlife conservation in Australia. CSIRO publishing.
Goldingay, R. L. 2009. Characteristics of tree hollows used by Australian birds and bats. Wildlife Research 36: 394-409.
Goldingay, R. L. 2017. Does nest box use reduce the fitness of a tree-cavity dependent mammal? Ecological Research 32: 495-502.
Green, R. E., Purcell, K. L., Thompson, C. M., Kelt, D. A., & Wittmer, H. U. 2018. Reproductive parameters of the fisher (Pekania pennanti) in the southern Sierra Nevada, California. Journal of Mammalogy 99(3), 537-553.
Hanson, Dan S., & Hargrave, Bryan. 1996. Development of a multilevel ecological classification system for the state of Minnesota. Environmental monitoring and assessment 39: 75-84.
Harper, M. J., McCarthy, M. A., & van der Ree, R. 2005. The use of nest boxes in urban natural vegetation remnants by vertebrate fauna. Wildlife Research 32: 509-516.
Holloway, G. L., & Malcolm, J. R. 2007. Nest-tree use by northern and southern flying squirrels in central Ontario. Journal of Mammalogy 88: 226-233.
Jönsson, M. T., Fraver, S., & Jonsson, B. G. 2009. Forest history and the development of old-growth characteristics in fragmented boreal forests. Journal of Vegetation Science 20: 91-106.
Joyce, M., Velander, T., McMahon, M., & Moen, R. 2022. Artificial den boxes for fishers. Final report to Legislative Citizen Commission on Minnesota’s Resources. 20 pp.
Joyce, M., & Moen, R. 2022. Fisher Den Box Building Plans. Natural Resources Research Institute, University of Minnesota Duluth, Technical Report NRRI/TR-2022/14. 9p.
Joyce, M. J., Zalewski, A., Erb, J. D., & Moen, R. A. 2017. Use of resting microsites by members of the Martes complex: the role of thermal stress across species and regions. The Martes complex in the 21st century: ecology and conservation. Bialowieza, Poland: Mammal Research Institute, 181-221.
Kendeigh, S. C. 1961. Energy of birds conserved by roosting in cavities. The Wilson Bulletin 73: 140-147.
Koprowski, J. L. 1994. Sciurus carolinensis. Mammalian species 480: 1-9.
Laurance, W. F., Delamônica, P., Laurance, S. G., Vasconcelos, H. L., & Lovejoy, T. E. 2000. Rainforest fragmentation kills big trees. Nature 404: 836-836.
Laurance, W. 2012. Big trees: how the mighty are fallin’. New Scientist 213: 39-41.
Lindenmayer, D. B., Laurance, W. F., & Franklin, J. F. 2012a. Global decline in large old trees. Science 338: 1305-1306.
Lindenmayer, D. B., Blanchard, W., McBurney, L., Blair, D., Banks, S., Likens, G. E., Franklin, J. F., Laurance, W. F., Stein, J. A. R., & Gibbons, P. 2012b. Interacting factors driving a major loss of large trees with cavities in a forest ecosystem. PLoS ONE 7: e41864. https://doi.org/10.1371/journal.pone.0041864.
Lindenmayer, D. B., Cunningham, R. B., & Donnelly, C. F. 1997. Decay and collapse of trees with hollows in eastern Australian forests: impacts on arboreal marsupials. Ecological Applications 7: 625-641.
Lindenmayer, D. B., Welsh, A., Donnelly, C., Crane, M., Michael, D., Macgregor, C., McBurney, L., Montague-Drake, R., & Gibbons, P. 2009. Are nest boxes a viable alternative source of cavities for hollow-dependent animals? Long-term monitoring of nest box occupancy, pest use and attrition. Biological Conservation 142: 33-42.
Lutz, J. A., Van Wagtendonk, J. W., & Franklin, J. F. 2009. Twentieth-century decline of large diameter trees in Yosemite National Park, California, USA. Forest Ecology and Management 257: 2296-2307.
KMarchand, P. J. 2014. Life in the cold: an introduction to winter ecology (4th Edition). University Press of New England, Lebanon, New Hampshire, USA.
Matthews, S. M., Green, D. S., Higley, J. M., Rennie, K. M., Kelsey, C. M., & Green, R. E. 2019. Reproductive den selection and its consequences for fisher neonates, a cavity-obligate mustelid. Journal of Mammalogy 100: 1305-1316.
McDowell, N. G., Allen, C. D., Anderson-Teixeira, K., Aukema, B. H., Bond-Lamberty, B., Chini, L., Clark, J. S., Dietze, M., Grossiard, C., Hanbury-Brown, A., Hurtt, G. C., Jackson, R. B., Johnson, D. J., Kueppers, L., Lichstein, J. W., Ogle, K., Poulter, B., Pugh, T. A. M., Seidl, R., Turner, M. G., Uriarte, M., Walker, A. P., & Xu, C. (2020). Pervasive shifts in forest dynamics in a changing world. Science, 368(6494), eaaz9463.
Moore, T., de Tores, P., & Fleming, P. A. 2010. Detecting, but not affecting, nest-box occupancy. Wildlife Research 37: 240-248.
Patacca, M., Lindner, M., Lucas‐Borja, M. E., Cordonnier, T., Fidej, G., Gardiner, B., … & Schelhaas, M. J. (2023). Significant increase in natural disturbance impacts on European forests since 1950. Global change biology, 29(5), 1359-1376.
Remm, J., & Lõhmus, A. 2011. Tree cavities in forests–the broad distribution pattern of a keystone structure for biodiversity. Forest Ecology and Management 262: 579-585.
Rueegger, N. N., Goldingay, R. L., & Brookes, L. O. 2012. Does nest box design influence use by the eastern pygmy-possum? Australian Journal of Zoology 60: 372-380.
Semel, B., & Sherman, P. W. 1995. Alternative placement strategies for wood duck nest boxes. Wildlife Society Bulletin 23: 463-471.
Smaal, M., & van Manen, W. 2017. Monitoring weasels (Mustela nivalis) with nest boxes. Lutra 60: 19-26.
Steele, M. A. 1998. Tamiasciurus hudsonicus. Mammalian species 586: 1-9.
Taulman, J. F. 1999. Selection of nest trees by southern flying squirrels (Sciuridae: Glaucomys volans) in Arkansas. Journal of zoology 248: 369-377.
Taulman, J. F., Smith, K. G., & Thill, R. E. 1998. Demographic and behavioral responses of southern flying squirrels to experimental logging in Arkansas. Ecological Applications 8: 1144-1155.
Utsey, F. M., & Hepp, G. R. 1997. Frequency of nest box maintenance: effects on wood duck nesting in South Carolina. The Journal of Wildlife Management 61: 801-807.
Velander, T. B., Joyce, M. J., Kujawa, A. M., Sanders, R. L., Keenlance, P. W., & Moen, R. A. 2023. A dynamic thermal model for predicting internal temperature of tree cavities and nest boxes. Ecological Modelling 478: 110302.
Weir, R. D., Phinney, M., & Lofroth, E. C. 2012. Big, sick, and rotting: why tree size, damage, and decay are important to fisher reproductive habitat. Forest Ecology and Management 265: 230-240.
Resetarits Jr, W. J., and Silberbush, A. 2016. “Local contagion and regional compression: habitat selection drives spatially explicit, multiscale dynamics of colonisation in experimental metacommunities.” Ecology Letters, 19(2), 191-200.
Wiebe, K. L. 2011. Nest sites as limiting resources for cavity‐nesting birds in mature forest ecosystems: a review of the evidence. Journal of Field Ornithology 82: 239-248.
Wisconsin Department of Natural Resources. 2014. Status of the American marten in Wisconsin – Performance Report. Bureau of Natural Heritage Conservation, Wisconsin Department of Natural Resources, Madison, Wisconsin.
Zárybnická, M., Kubizňák, P., Šindelář, J., & Hlaváč, V. 2016. Smart nest box: a tool and methodology for monitoring of cavity‐dwelling animals. Methods in Ecology and Evolution 7: 483-492.
Open Access
Peer-Reviewed
Creative Commons
Submitted: 7 June 2024
Accepted: 18 December 2025
Published: 13 June 2025
Funding Information: Minnesota Environmental and Natural Resources Trust Fund as recommended by the Legislative-Citizen Commission on Minnesota’s Resources and the Natural Resources Research Institute.
Conflicts of Interest: The authors declare no conflicts of interest.
© 2025 Joyce et al. Stacks Journal


