

Dances like wolves? Evaluating ecological replacement of apex predators in eastern North America
AJ: https://orcid.org/0000-0003-0340-7765
Jensen, A.J. (2025). Dances like wolves? Evaluating ecological replacement of apex predators in eastern North America. Stacks Journal: 25011. https://doi.org/10.60102/stacks-25011
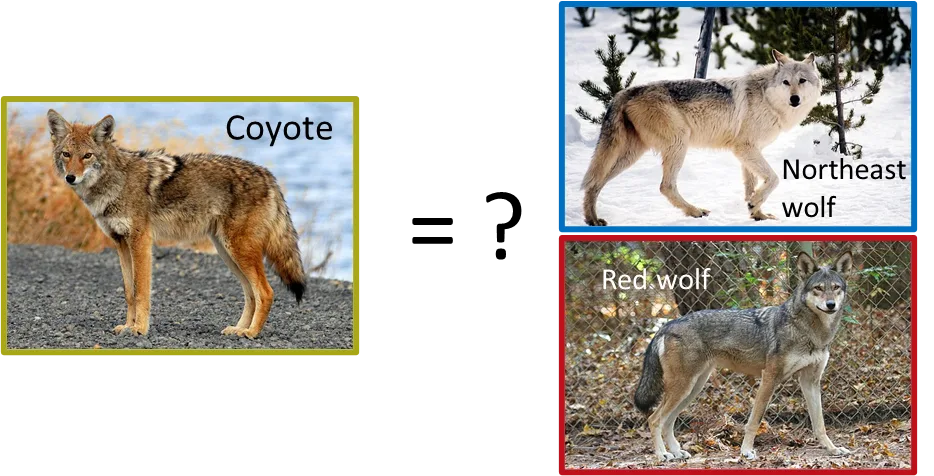
Abstract photo. Can coyotes fill the ecological role of wolves in eastern North America? I compared the dietary ecology of these canids by quantifying their diet across trophic levels, size of mammals in their diet, and cause-specific ungulate mortality. See Figure 1 for photo credit.
Abstract
Global reductions in large carnivore populations have likely contributed to range expansions by some mesopredators; however, it remains unclear to what extent these smaller carnivores can ecologically replace large carnivores. To test this replacement hypothesis, I used diet studies and cause-specific ungulate mortality studies to compare the dietary ecology of coyotes and wolves in eastern North America, a region which coyotes colonized in the last 120 years in the wake of wolf extirpation. Broadly, I found that coyotes had more diverse diets than wolves, but southeastern coyote diets were more similar to red wolves than northeastern coyote diets were to northeastern wolves. Across both regions, primary producers (i.e., fruit) were much more common in coyote samples (25-33%) compared to wolves (2-3%). In contrast, medium-sized herbivores (i.e., beaver, nutria) were much less common in coyote samples (10-13%), compared to wolves (45%). Coyotes ate smaller mammals than northeastern wolves, likely driven by their inability to kill the largest ungulates. Indeed, coyotes were not documented killing any moose in the mortality studies I reviewed, while wolves were responsible for a significant portion of adult moose and calf mortality. In the northeast, coyotes were responsible for more white-tailed deer fawn mortality (28% vs. 15% for wolves) and a similar percentage of adult mortality (18-22%). In the Southeast, coyotes were responsible for 40% of fawn mortality and 6% of adult deer mortality. These results suggest that coyotes and wolves have different but complementary impacts on white-tailed deer age classes, with predation risk from coyotes more temporally constrained and weaker indirect effects from coyotes related to killing adult large herbivores. Taken together, I show that coyotes likely have broader ecological effects than wolves, but the lack of evidence that they can regularly kill several important mammal species (moose, beaver, nutria) suggests that their capacity to replace wolves is restricted, particularly in the northeast.
Keywords: diet, coyote, large carnivore, Mesopredator, top-down effects, wolf
Introduction
Humans have facilitated dramatic changes in species distributions in the last several hundred years (Wolf & Ripple 2017), including contractions and expansions for 52% and 22% of mammal species, respectively (Pacifici et al. 2020). In some cases, these responses can be predicted by species traits; for example, biotic homogenization leads to a gradual replacement of communities of specialists with fewer (non-native) generalist species that are better able to tolerate humans (McKinney and Lockwood 1999). While it is clear that community assemblages have changed, it often remains unclear to what extent these new species can fill the ecological roles of species which have disappeared. Quantifying how the role of expanding species differs from those that have contracted is critical to understanding the consequences of humans changing ecological communities.
Global range contractions of large carnivores (> 14.5 kg) have received particular attention, including the ecological consequences of their disappearance (Ripple et al. 2014). Large carnivores can suppress populations within lower trophic levels, both directly through killing (Estes et al. 2011) and indirectly by changing other species’ behavior (Creel et al. 2007). Thus, the absence of many large carnivores across large portions of their historical range (Wolf and Ripple 2017) has led to speculation about how ecosystems have changed. For example, the mesopredator release hypothesis predicts that the decline of large carnivores should lead to increases in smaller carnivore populations (Soulé et al. 1988), which could negatively impact prey species of these smaller carnivores (Ritchie and Johnson 2009). While rigorous evidence in support of this hypothesis is limited (Jachowski et al. 2020, Castle et al. 2023), the disappearance of large carnivores has likely facilitated range expansion for some mesopredators across the globe (Prugh et al. 2009, Arnold et al. 2012, Hody & Kays 2018).
This situation raises an important question: to what extent can smaller carnivores ecologically replace large carnivores? This is also a timely question as large carnivores recolonize portions of their former ranges (LaRue et al. 2012, Chapron et al. 2014) and wildlife managers try to decide where to facilitate recovery via reintroductions. Regardless, there will likely be large portions of large carnivore ranges never recolonized, due to a lack of ecological or social support (Bruskotter & Wilson 2014, Carter & Linnell 2016). Thus, understanding the extent to which smaller carnivores fill their ecological roles could be an important consideration when making decisions related to facilitating large carnivore recovery.
Although carnivore ecology is multi-faceted, dietary ecology can provide key insights when comparing trophic effects from large and smaller carnivores. For example, carnivores vary in their dietary diversity, with implications for the degree to which they interact with other trophic levels (Ferretti et al. 2020). Indeed, carnivore size has been shown to be an important predictor of what they eat, as large carnivores often rely on prey at least as big as them (> 20 kg), while smaller carnivores can be sustained on prey smaller than themselves (Carbone et al. 2007). Thus, generalist small carnivores will likely consume food from more trophic levels than larger carnivores (Marneweck et al. 2022), thereby perhaps having reduced impacts on the prey populations that larger carnivores are more specialized on. In particular, many large carnivores regularly kill large herbivores, which may be a distinct role not filled by smaller carnivores (Benson et al. 2017, Prugh & Sivy 2020). Yet this could be complicated by changes in vulnerability as large herbivores age, as some smaller carnivores are much better at killing them when the herbivores are young (and not yet very large; Annear et al. 2023). Comparisons could also be complicated by the fact that many smaller carnivores are facultative scavengers (Prugh and Sivy 2020), making diet data alone insufficient to understand direct effects on prey populations.
To better understand the extent to which smaller carnivores can ecologically replace large carnivores, I compared the dietary ecology of wolves (Canis lupus, Canis lycaon, and Canis rufus) and coyotes (Canis latrans) across eastern North America. Prior to the 1800s, wolves roamed across most of North America and coyotes were restricted to the western 2/3rds of the continent (Figure 1; Hody and Kays 2018). However, by the mid 1900s, wolves were largely extirpated from the United States (US), with gray wolves and eastern wolves remaining in Canada and small populations of red wolves in the southeastern US (Nowak 2002, 2009). In more recent years, Great Lakes gray wolves (Canis lupus x Canis lycaon) have recolonized a portion of their former range in Michigan, Wisconsin, and Minnesota (Wydeven et al. 2009), while only a reintroduced population of red wolves remains in the wild in eastern North Carolina (Hinton et al. 2013). Likely facilitated by the extirpation of wolves (i.e., the mesopredator release hypothesis; Nowak 1967, Hinton et al. 2022), coyotes began expanding eastward around 1900 and have now colonized nearly all of eastern North America, much of which was the historical range of wolves (Figure 1; Hody and Kays 2018).
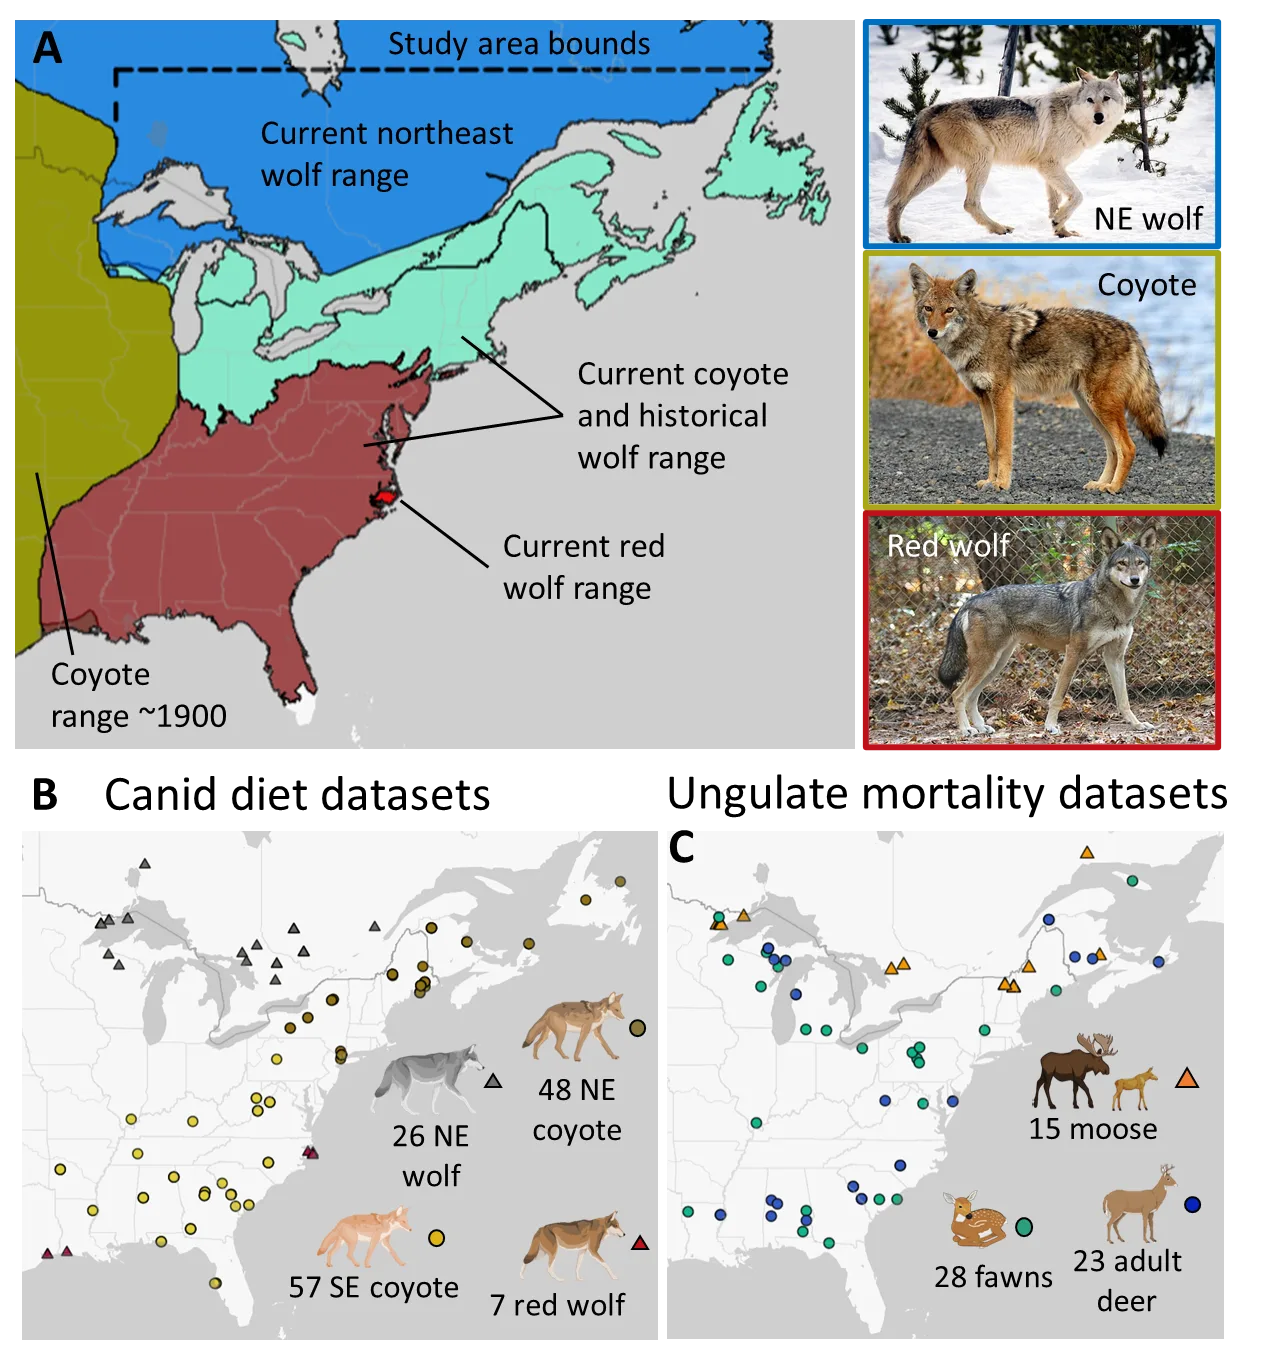
Figure 1. In A, I show an overview of where I reviewed studies on canid diet and ungulate predation in eastern North America. The gold region represents the eastern extent of coyote range in 1900 (per Hody and Kays 2018). The coyote study areas were within the area they colonized after 1900 and within the historical ranges of wolves in eastern North America. I delineated northeast and southeast using ecoregion level II boundaries (following USFWS 2016). In B, I show the distribution of canid diet studies, where NE and SE stand for northeast and Southeast, respectively. In C, I show the distribution of studies that tracked cause-specific mortality for white-tailed deer and moose. I classified studies on yearling deer as adults and some study sites contributed data for multiple age-classes (but points perfectly overlap). Illustrations created with BioRender.com. The gray wolf and coyote photos are in the public domain, while the red wolf credit is as follows: Red Wolf from United States (https://commons.wikimedia.org/wiki/File:Captive_Female_at_Sandy_Ridge_(6260981786).jpg), “Captive Female at Sandy Ridge (6260981786)“,https://creativecommons.org/licenses/by/2.0/legalcode.
Admittedly, there is some uncertainty about the genetic origins and number of species of wolf in eastern North America (Rutledge et al. 2015, vonHoldt et al. 2016, vonHoldt & Aardema 2020, Sacks et al. 2021, Vilaça et al. 2023). For example, the latest evidence suggests that eastern wolves (in Canada) and red wolves (in the Southeastern US) are the same species (Boyd et al. 2023); therefore, it might make sense to group them when making comparisons with coyotes. Yet the habitat (and likely food availability) in these two regions is very different, which would complicate inference. Instead, I made comparisons within regions, where I compared a combination of eastern wolves and Great Lakes wolves (collectively referred to as northeastern wolves) to northeastern coyotes, and compared red wolves to southeastern coyotes (see Methods for details).
To estimate ecological replacement, I used existing literature to 1) compare the diets of wolves and coyotes and 2) quantify large-herbivore mortality attributable to these canids. I restricted the coyote data to regions within the historical (but not current) range of wolves (i.e., areas where coyotes have ‘replaced’ wolves as the largest canid predator; Figure 1). Coyotes are substantially smaller than wolves: 11-17 kg in eastern North America (Hinton et al. 2019) compared to 20-38 kg for red wolves and eastern wolves (Hinton and Chamberlain 2014) and 26-45 kg for Great Lakes gray wolves (University of Minnesota). Due to relatively high energetic constraints imposed on larger bodies (Carbone et al. 2007), I hypothesized that wolves would be more specialized on larger prey compared to coyotes (Hinton et al. 2017, Benson et al. 2017; Table 1). As a consequence, I predicted that coyotes would have more diverse diets, which I tested by quantifying dietary diversity indices and by categorizing food items into distinct trophic levels. I also compared the size of wolf and coyote mammalian prey to more explicitly quantify differences in the size of their prey. Lastly, given the importance of large herbivore predation to understanding the ecological role of these canids, I compared the extent to which coyotes and wolves were responsible for ungulate mortality. I hypothesized that coyotes would primarily kill ungulate neonates while wolves would kill all age classes (Kilgo et al. 2012; Table 1). Ultimately, this study uses existing dietary ecology data to evaluate the extent to which a small carnivore has ecologically replaced large carnivores, and perhaps serves as an example of how to address this question in other systems as well.
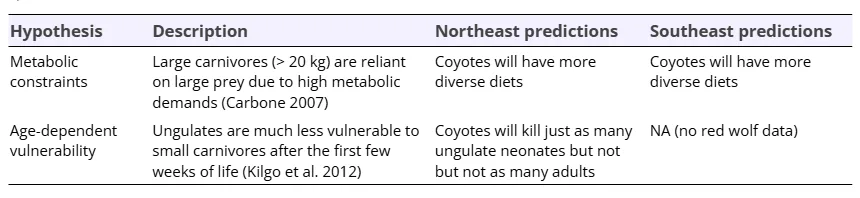
Table 1. Hypotheses and predictions for comparing coyote and wolf dietary ecology in eastern North America.
Methods and Materials
Ranges and study design
I curated studies on canid diets and ungulate mortality from eastern North America in the area that coyotes have colonized since 1900 (Figure 1a; Hody and Kays 2018). I compared coyotes in the Northeast to northeast (NE) wolves and coyotes in the Southeast to red wolves. To evaluate replacement by coyotes, I only studied coyotes within the historical ranges of wolves. Although there is some evidence that red wolves and eastern wolves are conspecific and their historical range included New England and New Brunswick (Nowak 2009, Boyd et al. 2023), I chose to delineate historical wolf ranges based on ecoregions (following USFWS 2016; Figure 1), such that coyote studies representing the Southeast were more representative of systems where data on red wolves exist (the coastal Southeast). Specifically, I sourced Southeast coyote studies from the following level II ecoregions: Mississippi Alluvial and Southeast USA Coastal Plains, Ozark/Ouachita-Appalachian Forests, South Central Semi-Arid Prairies, Southeastern USA Plains, and Texas-Louisiana Coastal Plains. I sourced NE coyote studies from north of these ecoregions within historical wolf range (Figure 1). I defined the study area for NE wolves as their current range (Defenders of Wildlife 2019) but east of the historical coyote range and south of 52° N (Figure 1), while the study area for red wolves was anywhere in the southeast where studies occurred. Although coyotes were likely present in most of the wolf study sites, I assumed that they had little influence on wolf diets given wolves are the dominant species (Berger and Gese 2007).
Canid diet data curation
I sourced literature on canid diets from multiple sources, including existing literature reviews and database searches (Figure S1). Studies had to meet two criteria to be included in analyses: 1) they had to be within the study area(s) as defined above and in Figure 1, and 2) they had to report diet data as % frequency of occurrence (%FO) or a metric that could be converted to it. I restricted this dataset to %FO because it is the most common metric, and diet quantification methods can be biased towards or against certain types of foods (Klare et al. 2011).
For NE wolves, I started with the ‘eastern Canadian’ and ‘Great Lakes’ studies which met my criteria for inclusion within a gray wolf diet review (Newsome et al. 2016). I supplemented this with a July 1, 2024 Web of Science search for more recent studies not captured by this review. Here TS stands for ‘topic’ and restricts the search to the title, abstract, or keywords, while PY stands for published year: TS=(“gray wolf” OR “canis lupus” OR “eastern wolf” OR “canis lycaon”) AND TS=(“diet”) AND TS=(“Ontario” OR “Quebec” OR “Newfoundland” OR “Labrador” OR “Minnesota” OR “Wisconsin” OR “Michigan”) AND PY=(2014-2024). I also used a July 1 2024 Web of Science search for red wolf diets: TS=(“red wolf” OR “canis rufus” ) AND TS=(“diet”). For coyotes, I started with the literature from a continental-scale coyote diet review (Jensen et al. 2022) within the northeastern and southeastern coyote study areas. I also supplemented this with a July 1, 2024 search for recent studies not captured by this review: TS=(“coyote” OR “canis latrans”) AND TS=(“diet”) AND PY=(2020-2024).
From each study, I quantified the amount of 11 food categories: 1) small rodents (hereafter ‘rodents’; ~0.1 kg); 2) small mammals (e.g., rabbit; ~0.1-2 kg); 3) medium-sized wild mammals (e.g., beaver; ~4-21 kg); 4) medium-sized wild ungulates (e.g., adult deer; ~23-130 kg); 5) large wild ungulates (e.g., adult moose; ~240-650 kg); 6) wild birds; 7) domesticated species; 8) insects; 9) fruit; 10) garbage; and 11) other (including large carnivores and fish). These are the same categories used by the gray wolf diet review (Newsome et al. 2016) with the addition of insects, which I added since coyotes often eat insects. For most prey categories, I summed values for different species within a single category. However, small prey item values are potentially artificially inflated when using %FO because multiple species can be in a single sample (Reynolds & Aebischer 1991). Therefore, for rodents, fruit, and insects, I recorded the largest %FO value for a species in those categories (Doherty et al. 2018). If a study reported data from multiple seasons, I treated each of these as separate datasets. I used web plot digitizer (Rohatgi 2023) to quantify amounts when they were only presented in figures. I also recorded the sample size and sample type (scat and/or intestinal tracts) from each study to test if they explained variation in the data.
I made adjustments based on the local availability of some key species and temporarily available neonate ungulates. For local availability, I excluded zero values for moose (Alces alces), white-tailed deer (Odocoileus virginianus: e.g., Isle Royale), and nutria (Myocastor coypus) within datasets where these species were not present according to their ranges on IUCN (ungulates; IUCN 2024) or the USGS (nutria; Procopio 2024). Although this does not fully mitigate the problem of spatial variation in prey availability, I think it helps. For neonate ungulates, I used diet datasets that reported neonates and adults separately (i.e., summer or fawning season timeframes; n = 19) to estimate the proportion of each age class for the summer and fawning season datasets that did not differentiate (n = 33). I did this by calculating the mean ungulate age class ratio and applying this ratio to the total ungulate frequency of occurrence for the studies that did not differentiate by age class. I did this separately for deer and moose and each focal canid. This allowed me to count white-tailed deer fawns (~3-16 kg) as medium-sized mammals and moose calves (~13-60 kg) as medium-sized ungulates since the wild mammal categories were differentiated by mass.
Dietary breadth
I predicted that coyotes would have more diverse diets compared to northeastern wolves and red wolves (Table 1). First, I compared dietary diversity by quantifying Levins’ measure of niche breadth for each dataset (Levins’ B; Levins 1968). I describe the statistical analysis to make this comparison (and other dietary comparisons) in a later section. I used all food categories except ‘other’ to calculate Levins’ B, which ranges from 1 to n food categories, where larger values indicate a more diverse diet. For a given dataset, Y was the total number of samples and Nj was the number of samples containing the jth food category of interest:
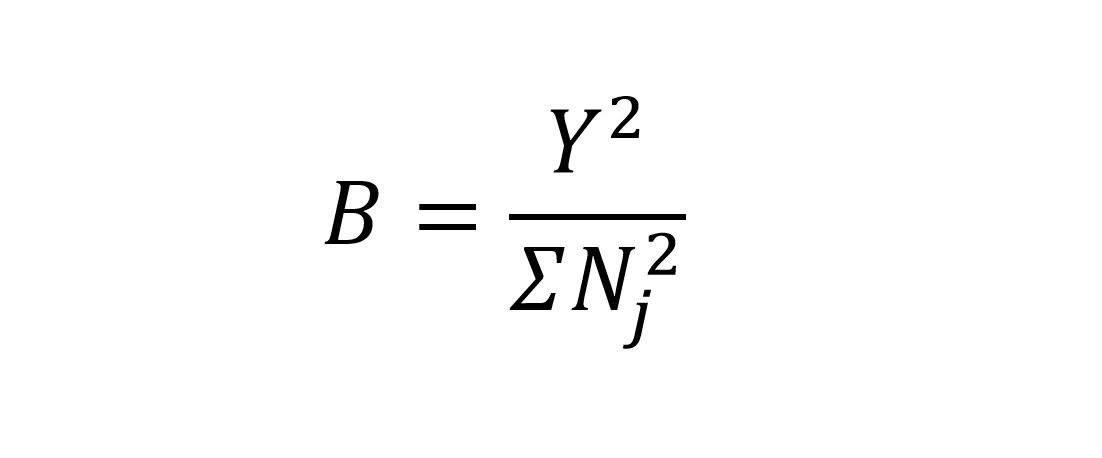
Equation 1.
Next, I tested for differences in trophic effects by reclassifying food items into five trophic levels. At the bottom were primary producers, which was just the fruit category. Next was small herbivores, which was the sum of rodents, small mammals, and insects. Next was medium herbivores, which were medium-sized mammals (not including Carnivora and opossums (Didelphis virginiana)). Next was large herbivores, which was a sum of medium and large wild ungulates. At the top was omnivores, which was a sum of birds, Carnivora, and opossums. I predicted that coyotes would eat more primary producers, more small herbivores, less medium herbivores, and less large herbivores (Levi & Wilmers 2012, Newsome et al. 2016, Jensen et al. 2022).
Size of wild mammals in diet
Here, I tested the hypothesis that energetic constraints imposed on larger bodies would lead to wolves consuming larger prey than coyotes (Carbone et al. 2007; Table 1). I first individually compared the five categories of wild mammals: rodents, small mammals, medium-sized mammals, medium-sized wild ungulates, and large wild ungulates. I then calculated the weighted average mass for each dataset by multiplying the average mass of each mammal category by its proportion in the diet from that dataset (the weighting factor) then summing those values. The average mass for each mammal category was as follows: rodent = 0.1 kg; small mammal = 2 kg; medium mammal = 11 kg; medium ungulate = 92 kg; large ungulate = 351 kg (Newsome et al. 2016).
Diet statistical analysis
I used generalized linear mixed models using the glmmTMB package (Brooks et al. 2019) for all diet analyses. The focal predictor variable was always canid species and site was always a random effect. I used site as a random effect to reduce the risk of pseudoreplication (assuming that the greatest source of variation was across different areas and not within studies themselves). The response variables were Levins’ B with a Gaussian distribution for the dietary diversity analysis; percent frequency of occurrence with a negative binomial distribution for the trophic levels and individual size category analyses; and mass-weighted frequency of occurrence (log-transformed) with a Gaussian distribution for the overall size analysis. I used a negative binomial distribution rather than a binomial distribution because there were two datasets where sample size was not reported (limiting my ability to treat them as count data). Prior to each main analysis, I tested for an effect of sample size and sample type on the response variable and carried that variable into the final model comparing canids if 95% confidence intervals did not overlap zero. Here are the general models for the northeast:
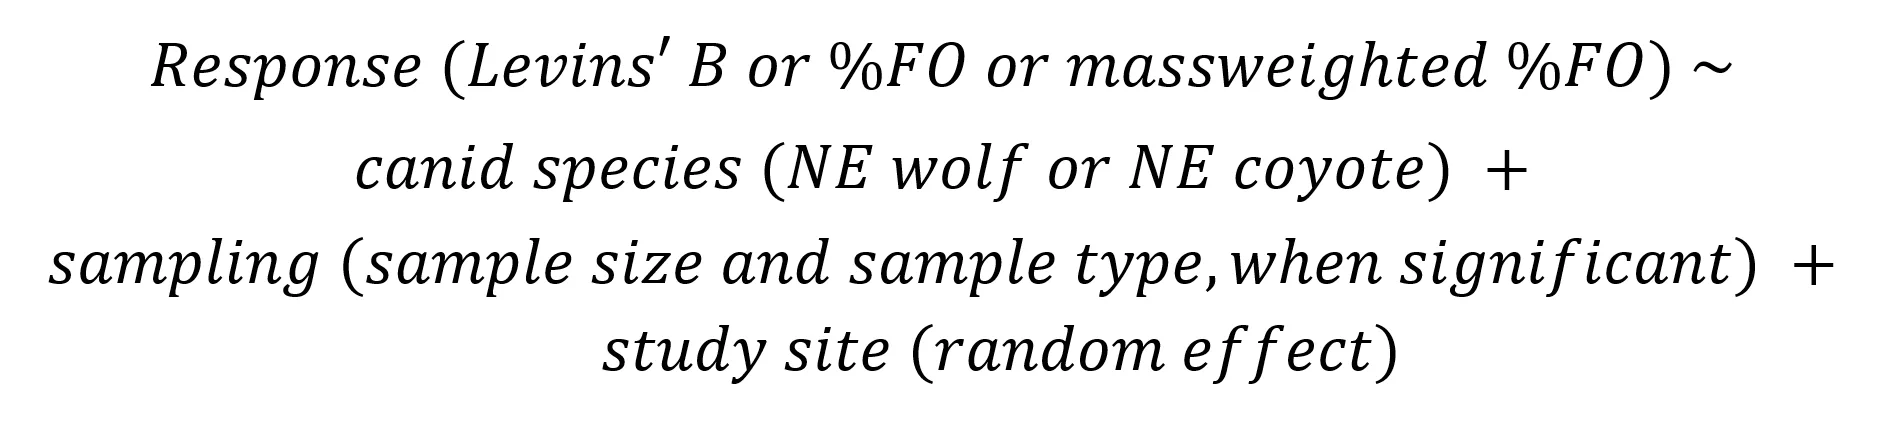
Equation 2.
I carried sample size into the primary consumer, medium-sized mammal, and small mammal models, but in each case, 95% confidence intervals overlapped zero when included with canid species, which I interpreted to mean that sample size had marginal effects on the response variables. I checked the fit of each model with the DHARMa package (Hartig 2018), where I interpreted p-values > 0.05 as evidence that model residuals were not over- or underdispersed. All analyses were conducted in R version 2024.04.2 and code used in analyses is available on Figshare: https://figshare.com/s/e0b2e7690376479672f6.
Cause-specific ungulate mortality
I sourced data on white-tailed deer and moose mortality from multiple sources, including existing reviews and literature searches. I did exploratory searches for elk and caribou, but there were not enough spatially-relevant studies to include them. For white-tailed deer fawns, I started with a 2018 review on cause-specific mortality (Gingery et al. 2018). I also looked at the literature cited by Kilgo et al. (2019) and Linnel (1995). I then searched for additional studies in Web of Science as follows. White-tailed deer fawns: TS=(“white-tailed deer” OR “Odocoileus virginianus”) AND TS=(“survival” OR “mortality” OR “predation”) AND TS=(“fawn” OR “neonate”). Adult white-tailed deer: TS=(“white-tailed deer” OR “Odocoileus virginianus”) AND TS=(“survival” OR “mortality” or “predation”) AND TS=(“adult”). Moose calves: TS=(“moose” OR “Alces alces”) AND TS=(“survival” OR “mortality” or “predation”) AND TS=(“calf” OR “neonate”). Moose adults: TS=(“moose” OR “Alces alces”) AND TS=(“survival” OR “mortality” or “predation”) AND TS=(“adult”). Some studies were on yearlings (between 3 and 12 months old – typically winter survival studies), so I recorded them as a separate age class. For each study, I recorded the percent of mortalities attributable to coyotes or wolves. There were five studies without predator-specific mortality data, but I obtained this data by emailing the authors.
I predicted that coyotes would kill a similar proportion of ungulate neonates but fewer adults compared to wolves (Kilgo et al. 2014, Benson et al. 2017; Table 1). The main comparison was between NE coyotes and NE wolves because I did not find any studies on ungulate mortality where red wolves occurred. However, I also report means for white-tailed deer mortality from SE coyotes without comparison since there were numerous studies in the Southeast. Models were structured similarly to the diet analyses, where percent mortality was the response variable (with a negative binomial distribution), and canid species was the predictor variable:

Equation 3.
I did not include study site as a random effect in this case because study areas were independent within age classes. I analyzed white-tailed deer fawns and adults separately and considered the difference between NE coyotes and NE wolves to be significant if 95% confidence intervals did not overlap zero. I did not find enough studies on white-tailed deer yearlings or on any age class of moose to conduct statistical analyses (Table 2), so for these datasets, I simply compared the average percent mortality descriptively.
Results
I found 138 datasets on coyote (n = 105) and wolf (n = 33) diets from 59 unique study sites distributed across eastern North America (Figure 1, https://figshare.com/s/749e1923ab711efccf8f).
Dietary breadth
I found support for my dietary diversity predictions (Table 1) as coyotes had more diverse diets than wolves in both the Northeast (estimate [95% confidence intervals] = 1.56 [0.93 : 2.20]) and in the Southeast (0.93 [0.15 : 1.71]).
I found that coyote and wolf diets differed significantly across every trophic level in the Northeast (Figure 2). NE coyotes ate more primary producers (estimate [95% confidence intervals] = 2.06 [1.38 : 2.75]), more small herbivores (2.29 [1.92 : 2.67]), and more omnivores (2.82 [1.79 : 3.85) than NE wolves. However, NE coyotes ate less medium herbivores (-1.54 [-2.34 : -0.73]) and less large herbivores (-0.36 : [-0.68 : -0.03]). In the Southeast, coyote and wolf diets differed across three of five trophic levels (Figure 2). SE coyotes ate more primary producers (2.43 [1.21 : 3.65]) and more omnivores (1.27 [0.46 : 2.08]), but less medium herbivores (-1.08 [-2.15 : -0.02]). SE coyotes and red wolves ate similar amounts of small herbivores (0.22 [-0.31 : 0.75]) and large herbivores (0.76 [-0.24 : 1.77]). Thus, the consistent differences across both regions were coyotes eating more primary producers and more omnivores, while eating less medium herbivores (Figure 2).
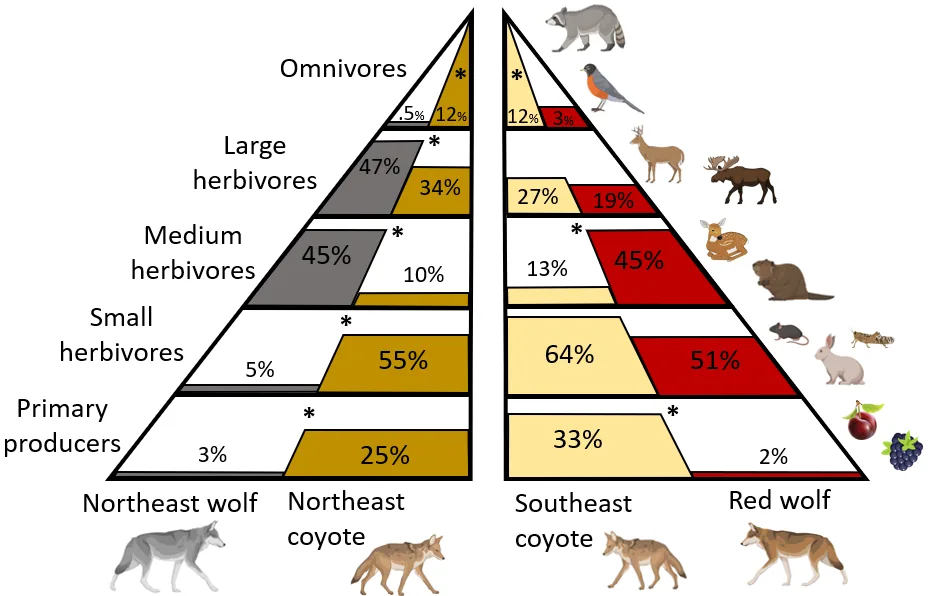
Figure 2. How canid diets were distributed across five trophic levels. Percentages are the average frequency of occurrence, where each trophic level is composed of one or more categories of food as follows: primary producers = fruit; small herbivores = small rodents, small mammals, and insects; medium herbivores = medium mammals plus juvenile medium ungulates minus carnivores and opossums; large herbivores = adult medium ungulates and large ungulates; omnivores = Carnivora, opossums, and birds. Note that since diets are measured in frequency of occurrence (percent of scats containing a given food category), the total percentage for each canid can sum to 100%. In addition, each trophic level is scaled separately such that the height of the bars should only be compared across that level. The * indicates a significant difference between canids within that region for that level. Illustrations from Biorender.com.
Size of mammals in diet
In the northeast, the size of mammalian prey differed between wolves and coyotes across every category but one (Figure 3). Coyote ate more rodents (1.89 [1.33 : 2.45] and small mammals (1.82 [1.20 : 2.44], but less medium mammals (-1.12 [-1.88 : -0.36]), less large wild ungulates (-2.07 [-3.23 : -0.91]), and similar amounts of medium wild ungulates (-0.19 [-0.75 : 0.38]). In line with my prediction (Table 1), coyotes also ate smaller mammals overall, averaging 60 kg to NE wolves 98 kg (-0.75 [-1.25 : -0.26]; Figure 3). In the Southeast, the prey size distribution for coyotes and red wolves was more similar (Figure 3). The only differences were coyotes ate less small mammals (-0.70 [-1.36 : -0.40]) and medium mammals (-1.16 [-2.14 : -0.18]). Coyotes and red wolves ate similar amounts of rodents (0.58 [-0.30 : 1.46]) and medium ungulates (0.76 [-0.24 : 1.77]), and, in contrast to my prediction, the average size of mammals in their diet was similar (27 kg and 23 kg; -0.03 [-1.06 : 0.99]; Figure 3).
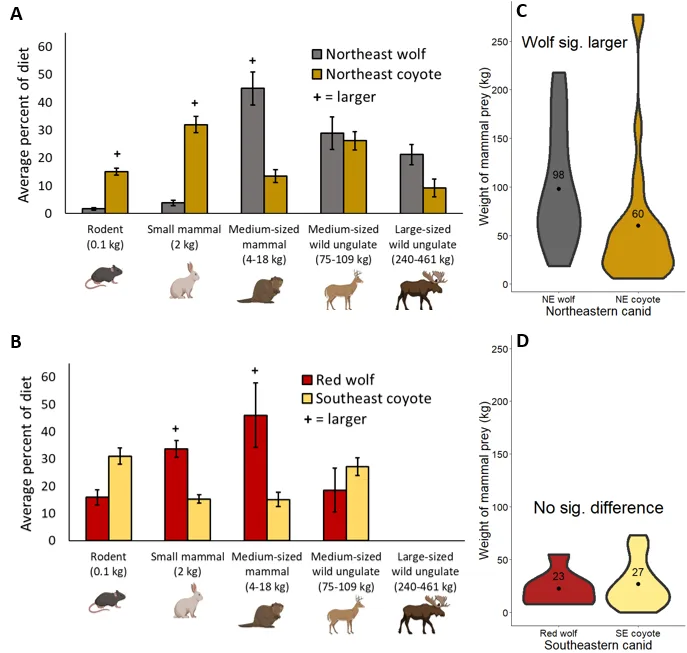
Figure 3. Comparing the size of mammalian prey for canids in eastern North America. In panels A and B, error bars represent standard error and a plus sign indicates significant differences (where 95% confidence intervals do not overlap zero). White-tailed deer fawns were included in the medium-sized mammal category while moose calves were included with the medium-sized wild ungulate category. Panels C and D show the average mass of mammalian prey, weighted by the frequency of occurrence in their diet. Illustrations from BioRender.com.
Comparing cause-specific ungulate mortality
I found 66 studies on ungulate mortality distributed across eastern North America, with 51 on white-tailed deer and 15 on moose (Figure 1, Table 2, https://figshare.com/s/0349843e290e94244e7c). For white-tailed deer, 55% of studies were on fawns, 35% were on adults, and 10% were on yearlings. There were no studies on yearlings from the Southeast (Table 2). Moose studies were more evenly distributed across age-classes, with 40% from calves, 33% from adults, and 27% from yearlings.
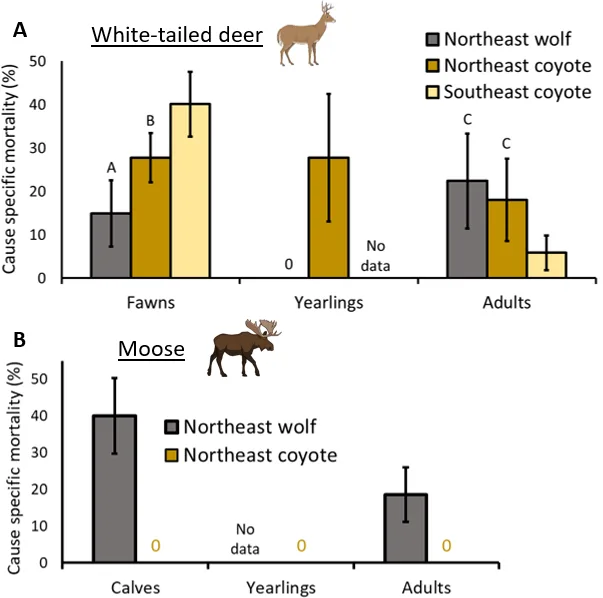
Figure 4. Comparing white-tailed deer (A) and moose mortality (B) caused by wolves and coyotes in eastern North America. Letters represent significant differences and there are no letters for moose because sample sizes were too small to conduct statistical analyses. Error bars represent standard error. Illustrations from BioRender.com.
For the white-tailed deer fawn analysis, I found that NE coyotes were responsible for a greater percentage of fawn mortality (28%) on average compared to NE wolves (15%; estimate [95% confidence intervals] = 0.97 [0.01 : 1.93]) as predicted, but SE coyotes killed the largest percentage (40%; Figure 4). However, in contrast to my prediction, NE coyotes killed a similar percentage of adult white-tailed deer (18%) compared with NE wolves (22%; -0.39 [-1.71 : 0.92]), whereas SE coyotes killed the lowest percentage (6%). NE coyotes also killed 28% of yearling white-tailed deer. Although there were not enough moose studies to conduct statistics, there were clear differences between wolves and coyotes (Figure 4): NE wolves killed a substantial portion of moose calves (40%) and adults (19%), while coyotes were not documented killing either age class.
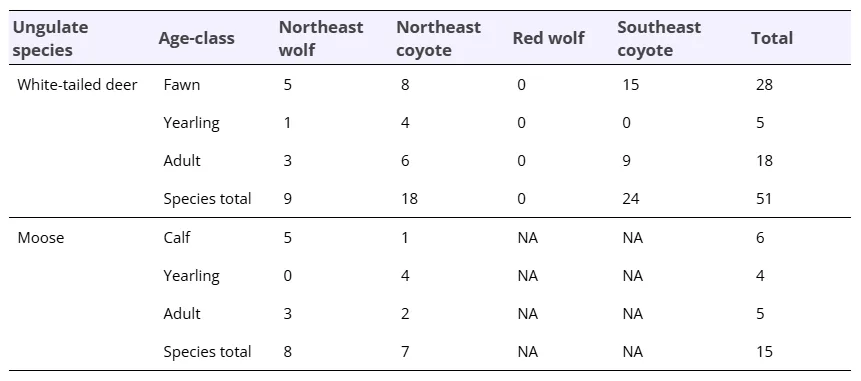
Table 2. Summary of sample sizes for ungulate mortality studies from eastern North America. There were no moose studies from the Southeast because moose do not occur there.
Discussion
I compared the top-down effects of coyotes and wolves in eastern North America and present three main takeaways: 1) coyotes have broader diets than wolves. In particular, the relatively high consumption of primary producers (wild fruits) and omnivores (birds and Carnivora) highlight interactions with trophic levels both below and above the levels wolves primarily consume (Marneweck et al. 2022). 2) There are key mammals that wolves kill, which coyotes largely do not: moose in the northeast and two ecologically important medium-sized herbivores (beavers and nutria). Unless coyotes can adapt to kill more of these species, they will still only partially fill the ecological role of wolves. 3) Coyotes and wolves are both adept predators of white-tailed deer, but the age-classes they kill seem to be largely complementary. This suggests that direct and indirect effects from coyotes are largely temporally constrained to fawning season (particularly in the Southeast) and that regulation on deer populations could be strongest where wolves and coyotes co-occur (Sih et al. 1998). Despite some sample size limitations for red wolves, my findings suggest that coyotes are likely filling a similar (if not broader) ecological role to this imperiled species (McVey et al. 2013). However, the rarity with which northeast coyotes kill moose (Benson et al. 2017) and beaver restricts their capacity to replace northeastern wolves.
Compared to wolves, coyotes likely have stronger top-down effects on the lowest trophic levels, with potential cascading ecological effects. Primary producers (mostly fruits) were ~10x more common in coyote diets, which could have at least two ecological implications. First, coyotes are likely contributing to (long-distance) seed dispersal for many of the fruits that they are eating (Willson 1993, Roehm & Moran 2013, Webster et al. 2024), which can also indirectly benefit granivorous rodents and secondary seed dispersers (Shakeri et al. 2018). Although there have been local studies on coyote seed dispersal, it remains unclear how this behavior has influenced communities across newly colonized regions (if at all). Second, these primary producers are typically only available for several weeks to months and so represent resource pulses (Ostfeld & Keesing 2000), which can potentially buffer short-term predation on other prey (Deacy et al. 2017), including vulnerable ungulate neonates. However, it is also possible that these resource pulses (and broader diets more generally) could maintain coyote populations at high densities even when populations of deer (and other prey) decline (Cherry et al. 2016, Benson et al. 2017). This could mean that coyotes continue to drive declines in populations of vertebrate prey even after prey become scarce, which would contrast with wolves, whose populations tend to be coupled with the populations of their large prey (Fuller 2003).
By contrast, medium herbivores were minor components of coyote diets, while they were a substantial portion of wolf diets. For NE wolves, the most common medium herbivore by far was beaver (Castor canadensis) – found in 33% of wolf samples on average. By killing dispersing beavers, wolves have been shown to alter when and where these ecosystem engineers alter ecological processes like creating wetlands (Gable et al. 2020). This beaver suppression is clearly not widely replaced by NE coyotes, as beavers were found in only 2% of their samples on average. For red wolves, nutria was the most common medium herbivore, found in 54% of scats. Nutria are also an ecologically important species because they are non-native and degrade wetland ecosystems via intensive herbivory (Friederike and Siebert 2020). Although most SE coyote studies were outside nutria’s North American distribution (along the Gulf Coast and mid-Atlantic Coast; Procopio 2024), there were five studies that overlapped with nutria range, none of which documented nutria in coyote diets. It should also be noted that the relatively high nutria consumption rate for red wolves was primarily driven by older studies in the Gulf Coast, whereas nutria were rarely reported in studies from eastern North Carolina (e.g., Hinton et al. 2017). Without more data on red wolves, it is difficult to assess how widespread their consumption of nutria is. Given both beaver and nutria are aquatic, these dietary differences could reflect avoidance of wetlands by coyotes compared to wolves (which seems to be the case in North Carolina; Hinton et al. 2015, 2016). Regardless, these differences in consumption of medium herbivores have two implications. First, they reveal a rather stark ecological difference between coyotes and large carnivores which has been largely overlooked; previous research has focused on comparing their impacts on large herbivores (Benson et al. 2017, Hinton et al. 2017, Petroelje et al. 2021) or mesocarnivores (Avrin et al. 2023). Second, the consistent use of medium-sized herbivores (particularly beavers) by wolves suggests that a specialization on larger prey predicted by energetic constraints (Carbone et al. 2007) can include prey smaller than just large herbivores.
Large herbivores (deer and moose combined) were an important component of both coyote and wolf diets in the northeast, but this belied clear differences in predation on each ungulate species and age class. NE wolves ate both deer and moose a similar amount and killed a substantial portion of both neonates and adults of both species. By contrast, deer were much more important in NE coyote diet than moose, and the mortality data suggest that the moose they did eat were largely scavenged. Indeed, despite killing just as many adult deer and more fawns than wolves in the northeast, coyotes were not documented killing any moose calves. Perhaps moose calves represent a higher risk (if defended by the mother) or coyotes are more adapted to hunt white-tailed deer, given their ranges overlap in eastern North America more than they overlap with larger ungulates (like moose and elk; IUCN 2024). Regardless, I was somewhat surprised not to document any moose mortality attributed to coyotes, given they have been documented killing moose in Ontario and Nova Scotia (Benson & Patterson 2013, Gehrt et al. 2023). Coyotes could adapt to kill more moose, particularly in areas where they hybridize with wolves (Kays et al. 2010); yet for now, killing the largest herbivores appears to be a clear distinction between wolves and coyotes (Benson et al. 2017).
Although I found no data on ungulate mortality for red wolves, there are still interesting comparisons to make using other results from the Southeast. For example, I estimated that fawns represent slightly more of the total deer consumed in the summer by coyotes (79%) compared to red wolves (68%; Figure S3). This may reflect slightly higher rates of adult deer predation by red wolves, which is supported by previous studies from the red wolf recovery area (Hinton et al. 2017). Although it is worth noting that the number of summer diet datasets that differentiated between deer age classes was limited for red wolves (n = 1) and somewhat limited for coyotes (n = 6). However, the year-round mortality data revealed that coyotes were responsible for a large portion of fawn mortality (40%) but rarely responsible for adult deer mortality (6%), supporting the high fawn representation in summer coyote diets. This aligns with past work in the Southeast, which highlights how coyotes are particularly effective fawn predators (Kilgo et al. 2014, 2019) also capable of killing adults (Chitwood et al. 2014). Deer are a substantial portion of coyote diets year-round in the Southeast (Jensen et al. 2022), which has led to debate about how they are obtained outside of fawning season. On one hand, fawn survival studies consistently show that predation quickly declines as the fawn ages (e.g., Kilgo et al. 2012, Nelson et al. 2015), suggesting that vulnerability would continue to decline into the fall and perhaps winter as well. Indeed, harsh winters and larger coyotes in the northeast (Hinton et al. 2019) likely partially explain higher rates of mortality on adult deer in this region (Kays et al. 2010). Furthermore, coyotes are proficient scavengers (Prugh & Sivy 2020, Ruprecht et al. 2021, Jensen et al. 2023), which combined with relatively low percentage of mortality on adult deer in the Southeast, supports the argument that scavenging represents the majority of deer in coyote diets outside of fawning season. On the other hand, some SE coyote studies have suggested that predation on adults primarily explains year-round consumption because coyote behavior and temporal peaks in consumption are not consistent with scavenging (Cherry et al. 2016, Hinton et al. 2017, Ward et al. 2018, Youngmann et al. 2022). Future studies could help answer this question definitively by continuing to monitor fawns through their first year of life (Ward et al. 2018).
Quantifying differences in age-class specific predation rates on ungulates and how those rates ultimately influence community dynamics is key for comparing the ecological effects of apex carnivores. Variation in predation rates across age classes determines the phenology of direct effects, where populations of carnivores that just kill neonates are only a threat in the summer, whereas the ability to kill adults extends their direct effects throughout the year. This would be particularly important in systems where predation on adult females is additive, given their survival can drive ungulate population dynamics (Robinson et al. 2014); and studies that link predation on specific age classes to ungulate population reductions would be the best evidence of top-down effects (Kilgo et al. 2014). Killing adult large herbivores can also influence systems in ways that smaller prey cannot, as large carcasses can provision scavengers and alter the distribution of soil nutrients (Selva & Fortuna 2007, Bump et al. 2009). Indeed, scavenged ungulates are an estimated 30% of mesocarnivore diets globally (Prugh & Sivy 2020), highlighting how this behavior can provide substantial benefits to other species despite also creating hotspots of encounter risk with large carnivores (Sivy et al. 2017). Thus, my results suggest that coyotes have partially replaced these indirect top-down effects in the northeast by killing adult deer (but not moose), while these effects are marginally replaced in the Southeast due to rarely killing adult deer.
In addition to herbivores, carnivores can also impact populations of omnivores and other species of (subordinate) carnivores (Prugh et al. 2009). Here, I found that coyotes eat more omnivores, with potentially important ecological implications. Birds were the majority (75%) of this trophic level for coyotes, highlighting another example of a clade that coyotes eat, but wolves rarely do. The remainder of this trophic level was mesopredators (i.e., raccoon, striped skunk, opossum; Procyon lotor, Mephitis mephitis), which, although found in a small portion of both coyote (~3%) and wolf samples (< 1%), could reflect stronger top-down effects from the more similarly-sized coyotes on mesopredators (Ritchie & Johnson 2009). Indeed, coyotes have been shown to have strong negative effects on foxes (Fedriani et al. 2000, Levi & Wilmers 2012), but mixed or neutral effects on other species like bobcats (Lynx rufus) and raccoons (Gehrt & Prange 2007, Dyck et al. 2022), suggesting that impacts are species- and context-specific. In the absence of wolves, coyotes have been hypothesized to target intermediate-sized prey (e.g., rabbits) and suppress foxes, thereby releasing pressure on both small prey (e.g., rodents – fox prey) and large prey (e.g., deer – wolf prey; Levi and Wilmers 2012). Yet my findings here show that coyotes regularly kill small prey and large prey (although most deer predation in the Southeast is likely via fawns). Taken together, this suggests that coyotes have not only partially replaced wolves but perhaps foxes as well.
This study has several limitations, which future work could address. First, although I tried to maximize the similarity in ecological conditions when making comparisons, differences in prey availability could also partially explain my findings. For example, it is possible that moose are more abundant (relative to deer) at wolf study areas compared to coyote study areas, partially explaining why wolves eat and kill more moose. Second, although it is clear that coyote diets could be influenced by wolves, I assumed that wolf diets were not influenced by coyotes. It is possible that coyotes could shape wolf diets, perhaps by scavenging their kills or being more efficient predators of some prey species (e.g., deer fawns, small rodents). One potential solution to these limitations could be using stable isotope analysis on wolf specimens from their historical ranges and comparing those data to stable isotope data from coyotes that overlap spatially. Third, although diet and prey mortality data are useful, there is a need for population data to quantify how different diets scale up to shape the population dynamics of their prey (Emerson et al. 2024). For example, Benson et al. (2017) predicted that coyotes would be more likely than wolves to have destabilizing effects on prey populations because their dietary flexibility will allow them to maintain high densities even when key prey populations decline. Natural experiments with good data on changes in large carnivore abundances will continue to provide insight into how their presence alters systems (Levi & Wilmers 2012, Bragina et al. 2019, Murray et al. 2023).
Conclusions
One of the key arguments for global large carnivore restoration is that they have irreplaceable top-down effects (Estes et al. 2011), yet this had yet to be tested at a broad scale. Unlike NE wolves, NE coyotes rarely kill moose and beavers; thus these roles in particular could be cited to promote wolf recovery in regions where managers want to regulate populations or the behavior of these herbivores. In the southeast, I highlight the control of an invasive species (nutria) as an ecosystem service performed by red wolves (in their historical range) but apparently not by coyotes. More broadly, this finding supports a growing number of examples of invasive species control by large carnivores, including pumas killing feral horses (Andreasen et al. 2021) and wolves suppressing wild pig populations (Villeneuve et al. 2022). However, unlike northeastern wolves (and gray wolves more generally), red wolf recovery has been arduous and nonlinear (USFWS 2023). Thus, if the wild red wolf population never expands outside of the recovery area in eastern North Carolina (or fails), it may be some consolation that coyotes seem to have fairly similar top-down effects across the historical range of this imperiled wolf species.
Carnivore ecology is multi-dimensional, and I only compared dietary ecology (Figure 5), leaving several avenues open for future research. First, there has been growing inquiry into indirect (non-consumptive) effects from predators (Say-Sallaz et al. 2019). A series of studies in the Southeast suggest that coyotes have measurable effects on deer antipredator behavior and reproduction (Cherry et al. 2015, 2016), while other studies suggest that mesocarnivores do not change their prey or competitor’s behavior like larger carnivores can (Schuttler et al. 2017, Shores et al. 2019, Avrin et al. 2023). A comparative synthesis on indirect effects in the context of ecological replacement would complement this paper well. Second, habitat use is relevant in this context of ecological replacement – wolves are more or less restricted to forests due to human persecution, while coyotes are much more cosmopolitan (Kays et al. 2008, Benson et al. 2012). Indeed, many mesopredators have a higher tolerance for human-induced disturbance and therefore are exerting their top-down effects in systems where large carnivores do not (and likely would not even if they were to recolonize more of their historic ranges; Van Den Bosch et al. 2022). Along these lines, comparing human attitudes on large and smaller carnivores (Weckel et al. 2015), and even how they influence attitudes on wildlife more broadly (Gompper 2002), could be an important future line of inquiry in the context of ecological replacement. Ultimately, my findings show that smaller carnivores can (at least) partially) replace the ecological roles of large carnivores, and understanding where and how they differ will help us make ecologically informed management decisions.
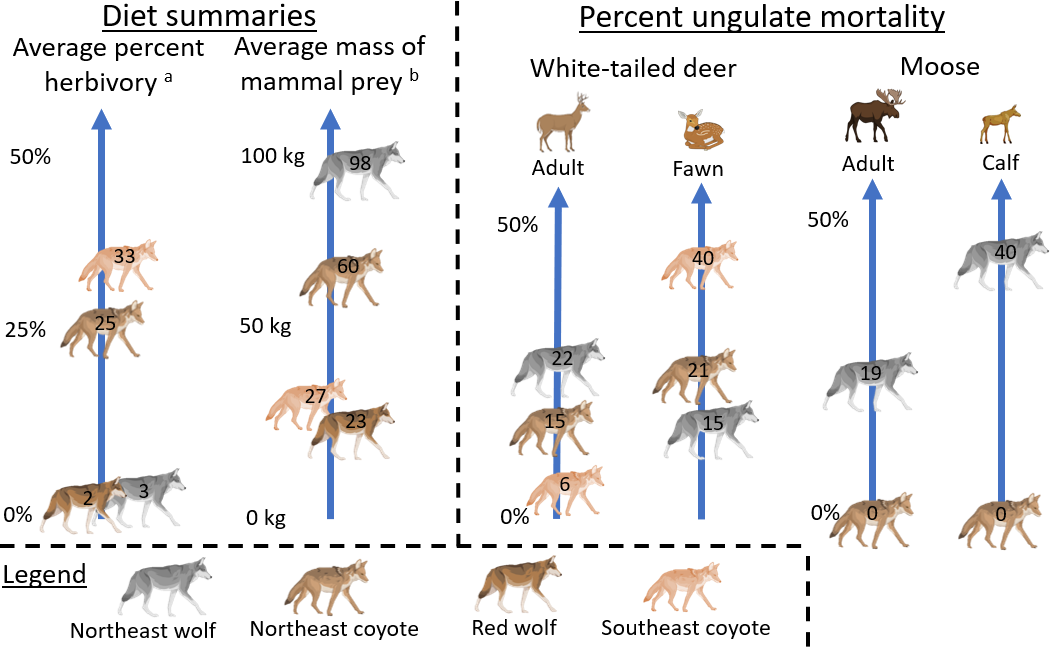
Figure 5. A graphical summary showing key comparisons between the dietary ecology of coyotes and wolves. Superscripts: a) the average frequency of occurrence of fruit in diet; b) the average mass of mammal prey (weighted by frequency of occurrence) in diet. I also show the average cause specific mortality attributed to wolves and coyotes for two ungulate species and age classes. Illustrations from Biorender.com.
Acknowledgments
I appreciate all of the authors whose work I reviewed in this study, particularly those who responded to my emails requesting more details. Thanks also to Roland Kays, two anonymous reviewers, and Stacks Journal’s collaborators for providing feedback on drafts.
Author Contributions
Alex J. Jensen: Conceptualization, data curation, formal analysis, investigation, methodology, visualization, writing – original draft.
Data Availability
The data and code used to perform analysis are available at the links below:
Diet data: https://figshare.com/s/749e1923ab711efccf8f
Ungulate mortality data: https://figshare.com/s/0349843e290e94244e7c
R code files: https://figshare.com/s/e0b2e7690376479672f6
Transparent Peer Review
Results from the Transparent Peer Review can be found here.
Supplemental Information
Supplemental information can be found here.
Recommended Citation
Jensen, A.J. (2025). Dances like wolves? Evaluating ecological replacement of apex predators in eastern North America. Stacks Journal: 25011. https://doi.org/10.60102/stacks-25011
References
Andreasen AM, Stewart KM, Longland WS, Beckmann JP (2021) Prey Specialization by Cougars on Feral Horses in a Desert Environment. The Journal of Wildlife Management 85: 1104–1120.
Annear E, Minnie L, Andrew K, Kerley GI (2023) Can smaller predators expand their prey base through killing juveniles? The influence of prey demography and season on prey selection for cheetahs and lions. Oecologia, 201: 649-660.
Arnold J, Humer A, Heltai M, Murariu D, Spassov N, Hackländer K (2012) Current status and distribution of golden jackals Canis aureus in Europe. Mammal Review 42: 1–11.
Avrin AC, Pekins CE, Wilmers CC, Sperry JH, Allen ML (2023) Can a mesocarnivore fill the functional role of an apex predator? Ecosphere 14: e4383.
Benson JF, Loveless KM, Rutledge LY, Patterson BR (2017) Ungulate predation and ecological roles of wolves and coyotes in eastern North America. Ecological Applications 27: 718–733.
Benson JF, Patterson BR (2013) Moose (Alces alces) predation by eastern coyotes (Canis latrans) and eastern coyote × eastern wolf (Canis latrans × Canis lycaon) hybrids. Canadian Journal of Zoology 91: 837–841.
Benson JF, Patterson BR, Wheeldon TJ (2012) Spatial genetic and morphologic structure of wolves and coyotes in relation to environmental heterogeneity in a Canis hybrid zone. Molecular Ecology 21: 5934–5954.
Berger KM, Gese EM (2007) Does interference competition with wolves limit the distribution and abundance of coyotes? Journal of Animal Ecology 76: 1075–1085.
Boyd DK, Ausband DE, Cluff HD, Heffelfinger JR, Hinton JW, Patterson BR, Wydevan AP (2023) North American wolves. Pages 32.1-32.68 in Wild furbearer management and conservation in North America. Wildlife Ecology Institute, Helena, Montana, USA. https://www.wildlifeecology.org/uploads/6/7/6/7/67673403/wei_vol2_ch32_northamericanwolves_final_10aug2023.pdf
Bragina EV, Kays R, Hody A, Moorman CE, Deperno CS, Mills LS (2019) Effects on white‐tailed deer following eastern coyote colonization. The Journal of Wildlife Management 83: 916–924.
Bruskotter JT, Wilson RS (2014) Determining Where the Wild Things will be: Using Psychological Theory to Find Tolerance for Large Carnivores. Conservation Letters 7: 158–165.
Bump JK, Peterson RO, Vucetich JA (2009) Wolves modulate soil nutrient heterogeneity and foliar nitrogen by configuring the distribution of ungulate carcasses. Ecology 90: 3159–3167.
Carbone C, Teacher A, Rowcliffe JM (2007) The Costs of Carnivory (AP Dobson, Ed). PLoS Biology 5: e22.
Carter NH, Linnell JDC (2016) Co-Adaptation Is Key to Coexisting with Large Carnivores. Trends in Ecology & Evolution 31: 575–578.
Castle G, Kennedy MS, Allen BL (2023) Stuck in the mud: Persistent failure of ‘the science’ to provide reliable information on the ecological roles of Australian dingoes. Biological Conservation 285: 110234.
Chapron G, Kaczensky P, Linnell JDC, Von Arx M, Huber D, Andrén H et al. (2014) Recovery of large carnivores in Europe’s modern human-dominated landscapes. Science 346: 1517–1519.
Cherry MJ, Conner LM, Warren RJ (2015) Effects of predation risk and group dynamics on white-tailed deer foraging behavior in a longleaf pine savanna. Behavioral Ecology 26: 1091-1099.
Cherry MJ, Morgan KE, Rutledge BT, Conner LM, Warren RJ (2016) Can coyote predation risk induce reproduction suppression in white‐tailed deer? Ecosphere 7: p.e01481.
Cherry MJ, Turner KL, Howze MB, Cohen BS, Conner LM, Warren RJ (2016) Coyote diets in a longleaf pine ecosystem. Wildlife Biology 22: 64–70.
Chitwood MC, Lashley MA, Moorman CE, DePerno CS (2014) Confirmation of Coyote Predation on Adult Female White-Tailed Deer in the southeastern United States. Southeastern Naturalist 13: N30–N32.
Creel S, Christianson D, Liley S, Winnie JA (2007) Predation Risk Affects Reproductive Physiology and Demography of Elk. Science 315: 960–960.
Deacy WW, Armstrong JB, Leacock WB, Robbins CT, Gustine DD, Ward EJ, Erlenbach JA, Stanford JA (2017) Phenological synchronization disrupts trophic interactions between Kodiak brown bears and salmon. Proceedings of the National Academy of Sciences 114: 10432–10437.
Defenders of Wildlife (2019) Gray Wolf Current North American Range.
Dyck MA, Wyza E, Popescu VD (2022) When carnivores collide: a review of studies exploring the competitive interactions between bobcats Lynx rufus and coyotes Canis latrans. Mammal Review 52: 52–66.
Emerson LD, Wittmer HU, Elbroch LM, Kostoglou K, Bannister KJ, Psaila JJ, Whisson D, Ritchie EG (2024) A global assessment of large terrestrial carnivore kill rates. Biological Reviews: brv.13143.
Estes JA, Terborgh J, Brashares JS, Power ME, Berger J, Bond WJ et al. (2011) Trophic Downgrading of Planet Earth. Science 333: 301–306.
Fedriani JM, Fuller TK, Sauvajot RM, York EC (2000) Competition and intraguild predation among three sympatric carnivores. Oecologia 125: 258–270.
Ferretti F, Lovari S, Lucherini M, Hayward M, Stephens PA (2020) Only the largest terrestrial carnivores increase their dietary breadth with increasing prey richness. Mammal Review 50: 291–303.
Ford AT, Goheen JR (2015) Trophic Cascades by Large Carnivores: A Case for Strong Inference and Mechanism. Trends in Ecology & Evolution 30: 725–735.
Fuller T, Mech D, Cochrane J (2003) Wolf Population Dynamics. Wolves: Behavior, Ecology, and Conservation, Chicago & London: University of Chicago Press.
Gable TD, Johnson-Bice SM, Homkes AT, Windels SK, Bump JK (2020) Outsized effect of predation: Wolves alter wetland creation and recolonization by killing ecosystem engineers. Science Advances 6: eabc5439.
Gehrt SD, Muntz EM, Wilson EC, Power JWB, Newsome SD (2023) Severe environmental conditions create severe conflicts: A novel ecological pathway to extreme coyote attacks on humans. Journal of Applied Ecology 60: 353–364.
Gehrt SD, Prange S (2007) Interference competition between coyotes and raccoons: a test of the mesopredator release hypothesis. Behavioral Ecology 18: 204–214.
Gethöffer F, Siebert U (2020) Current knowledge of the Neozoa, Nutria and Muskrat in Europe and their environmental impacts. Journal of Wildlife and Biodiversity 4.
Gingery TM, Diefenbach DR, Wallingford BD, Rosenberry CS (2018) Landscape‐level patterns in fawn survival across North America. The Journal of Wildlife Management 82: 1003–1013.
Gompper ME (2002) Top Carnivores in the Suburbs? Ecological and Conservation Issues Raised by Colonization of North eastern North America by Coyotes. BioScience 52: 185.
Hinton JW, Van Manen FT, Chamberlain MJ (2015) Space use and habitat selection by resident and transient coyotes (Canis latrans). PLoS One 10: p.e0132203.
Hinton JW, Proctor C, Kelly MJ, van Manen FT, Vaughan MR, Chamberlain MJ (2016) Space use and habitat selection by resident and transient red wolves (Canis rufus). PLoS One 11: p.e0167603.
Hinton JW, Ashley AK, Dellinger JA, Gittleman JL, Van Manen FT, Chamberlain MJ (2017) Using diets of Canis breeding pairs to assess resource partitioning between sympatric red wolves and coyotes. Journal of Mammalogy 98: 475–488.Hinton JW, Ashley AK, Dellinger JA, Gittleman JL, Van Manen FT, Chamberlain MJ (2017) Using diets of Canis breeding pairs to assess resource partitioning between sympatric red wolves and coyotes. Journal of Mammalogy 98: 475–488.
Hinton JW, Heppenheimer E, West KM, Caudill D, Karlin ML, Kilgo JC et al. (2019) Geographic patterns in morphometric and genetic variation for coyote populations with emphasis on southeastern coyotes. Ecology and Evolution 9: 3389–3404.
Hinton JW, West KM, Sullivan DJ, Frair JL, Chamberlain MJ (2022) The natural history and ecology of melanism in red wolf and coyote populations of the southeastern United States – evidence for Gloger’s rule. BMC Zoology 7: 33.
Hinton JW, Chamberlain, MJ (2014) Morphometrics of Canis taxa in eastern North Carolina. Journal of Mammalogy 95: 855-861
Hinton J, Chamberlain M, Rabon D (2013) Red Wolf (Canis rufus) Recovery: A Review with Suggestions for Future Research. Animals 3: 722–744.
Hody JW, Kays R (2018) Mapping the expansion of coyotes (Canis latrans) across North and Central America. ZooKeys 759: 81–97.
IUCN (2024) The IUCN Red List of Threatened Species.
Jachowski DS, Butler A, Eng RYY, Gigliotti L, Harris S, Williams A (2020) Identifying mesopredator release in multi‐predator systems: a review of evidence from North America. Mammal Review 50: 367–381.
Jensen AJ, Marneweck CJ, Kilgo JC, Jachowski DS (2022) Coyote diet in North America: geographic and ecological patterns during range expansion. Mammal Review 52: 480–496.
Jensen AJ, Saldo EA, Chapman ZG, Butfiloski JW, Jachowski DS (2023) Risk from a top predator and forest structure influence scavenging by smaller carnivores. Ecosphere 14: e4596.
Kays R, Curtis A, Kirchman JJ (2010) Rapid adaptive evolution of northeastern coyotes via hybridization with wolves. Biology Letters 6: 89–93.
Kays RW, Gompper ME, Ray JC (2008) Landscape ecology of eastern coyotes based on large-scale estimates of abundance. Ecological Applications 18: 1014–1027.
Kilgo JC, Cherry MJ, Ditchkoff SS, Gulsby WD, Miller KV (2019) Coyotes and white‐tailed deer populations in the east: A comment on Bragina et al. (2019). The Journal of Wildlife Management 83: 1636–1640.
Kilgo JC, Ray HS, Vukovich M, Goode MJ, Ruth C (2012) Predation by coyotes on white‐tailed deer neonates in South Carolina. The Journal of Wildlife Management 76: 1420–1430.
Kilgo JC, Vukovich M, Scott Ray H, Shaw CE, Ruth C (2014) Coyote removal, understory cover, and survival of white-tailed deer neonates: Coyote Control and Fawn Survival. The Journal of Wildlife Management 78: 1261–1271.
LaRue MA, Nielsen CK, Dowling M, Miller K, Wilson B, Shaw H, Anderson CR (2012) Cougars are recolonizing the midwest: Analysis of cougar confirmations during 1990–2008. The Journal of Wildlife Management 76: 1364–1369.
Levi T, Wilmers CC (2012) Wolves–coyotes–foxes: a cascade among carnivores. Ecology 93: 921–929.
Linnell JDC, Aanes R, Andersen R (1995) Who killed Bambi? The role of predation in the neonatal mortality of temperate ungulates. Wildlife Biology 1: 209–223.
Marneweck CJ, Allen BL, Butler AR, Do Linh San E, Harris SN, Jensen AJ et al. (2022) Middle‐out ecology: small carnivores as sentinels of global change. Mammal Review 52: 471–479.
McKinney ML, Lockwood JL (1999) Biotic homogenization: a few winners replacing many losers in the next mass extinction. Trends in Ecology & Evolution 14: 450–453.
McVey JM, Cobb DT, Powell RA, Stoskopf MK, Bohling JH, Waits LP, Moorman CE (2013) Diets of sympatric red wolves and coyotes in northeastern North Carolina. Journal of Mammalogy 94: 1141–1148.
Murray A, Sutherland R, Kays R (2023) Ecological effects of a declining red wolf population. Animal Conservation: acv.12919.
Nelson MA, Cherry MJ, Howze MB, Warren RJ, Conner LM (2015) Coyote and Bobcat Predation on White-tailed Deer Fawns in a Longleaf Pine Ecosystem in Southwestern Georgia.
Newsome TM, Boitani L, Chapron G, Ciucci P, Dickman CR, Dellinger JA et al. (2016) Food habits of the world’s grey wolves. Mammal Review 46: 255–269.
Nowak R (1967) The red wolf in Louisiana. Defenders of Wildlife News: 60–70.
Nowak RM (2002) The original status of wolves in eastern North America. Southeastern Naturalist 1: 95–130.
Nowak RM (2009) Taxonomy, Morphology, and Genetics of Wolves in the Great Lakes Region. In: Wydeven AP, Van Deelen TR, Heske EJ (eds) Recovery of Gray Wolves in the Great Lakes Region of the United States, 233–250. Springer New York, New York, NY.
Ostfeld RS, Keesing F (2000) Pulsed resources and community dynamics of consumers in terrestrial ecosystems. Trends in Ecology & Evolution 15: 232–237.
Pacifici M, Rondinini C, Rhodes JR, Burbidge AA, Cristiano A, Watson JEM, Woinarski JCZ, Di Marco M (2020) Global correlates of range contractions and expansions in terrestrial mammals. Nature Communications 11: 2840.
Patterson BR, Messier F (2000) Factors Influencing Killing Rates of White-Tailed Deer by Coyotes in Eastern Canada. The Journal of Wildlife Management 64: 721.
Petroelje TR, Kautz TM, Beyer DE, Belant JL (2021) Interference competition between wolves and coyotes during variable prey abundance. Ecology and Evolution 11: 1413–1431.
Procopio J (2024) Myocastor coypus (Molina, 1782): U.S. Geological Survey, Nonindigenous Aquatic Species Database.
Prugh LR, Sivy KJ (2020) Enemies with benefits: integrating positive and negative interactions among terrestrial carnivores (A Sih, Ed). Ecology Letters 23: 902–918.
Prugh LR, Stoner CJ, Epps CW, Bean WT, Ripple WJ, Laliberte AS, Brashares JS (2009) The Rise of the Mesopredator. BioScience 59: 779–791.
Ripple WJ, Estes JA, Beschta RL, Wilmers CC, Ritchie EG, Hebblewhite M et al. (2014) Status and Ecological Effects of the World’s Largest Carnivores. Science 343: 1241484.
Ritchie EG, Johnson CN (2009) Predator interactions, mesopredator release and biodiversity conservation. Ecology Letters 12: 982–998.
Robinson KF, Diefenbach DR, Fuller AK, Hurst JE, Rosenberry CS (2014) Can managers compensate for coyote predation of white‐tailed deer? The Journal of Wildlife Management 78: 571–579.
Roehm K, Moran MD (2013) Is the Coyote (Canis latrans) a Potential Seed Disperser for the American Persimmon (Diospyros virginiana)? The American Midland Naturalist 169: 416–421.
Rohatgi A (2023) WebPlotDigitizer.
Ruprecht J, Eriksson CE, Forrester TD, Spitz DB, Clark DA, Wisdom MJ et al. (2021) Variable strategies to solve risk–reward tradeoffs in carnivore communities. Proceedings of the National Academy of Sciences 118: e2101614118.
Rutledge LY, Bos KI, Pearce RJ, White BN (2010) Genetic and morphometric analysis of sixteenth century Canis skull fragments: implications for historic eastern and gray wolf distribution in North America. Conservation Genetics 11: 1273–1281.
Rutledge LY, Devillard S, Boone JQ, Hohenlohe PA, White BN (2015) RAD sequencing and genomic simulations resolve hybrid origins within North American Canis. Biology Letters 11: 20150303.
Sacks BN, Mitchell KJ, Quinn CB, Hennelly LM, Sinding MS, Statham MJ et al. (2021) Pleistocene origins, western ghost lineages, and the emerging phylogeographic history of the red wolf and coyote. Molecular Ecology 30: 4292–4304.
Say-Sallaz E, Chamaillé-Jammes S, Fritz H, Valeix M (2019) Non-consumptive effects of predation in large terrestrial mammals: Mapping our knowledge and revealing the tip of the iceberg. Biological Conservation 235: 36–52.
Schuttler SG, Parsons AW, Forrester TD, Baker MC, McShea WJ, Costello R, Kays R (2017) Deer on the lookout: how hunting, hiking and coyotes affect white‐tailed deer vigilance. Journal of Zoology 301: 320–327.
Selva N, Fortuna MA (2007) The nested structure of a scavenger community. Proceedings of the Royal Society B: Biological Sciences 274: 1101–1108.
Shakeri YN, White KS, Levi T (2018) Salmon‐supported bears, seed dispersal, and extensive resource subsidies to granivores. Ecosphere 9: e02297.
Shores CR, Dellinger JA, Newkirk ES, Kachel SM, Wirsing AJ (2019) Mesopredators change temporal activity in response to a recolonizing apex predator (J Quinn, Ed). Behavioral Ecology 30: 1324–1335.
Sih A, Englund G, Wooster D (1998) Emergent impacts of multiple predators on prey. Trends in Ecology & Evolution 13: 350–355.
Sivy KJ, Pozzanghera CB, Grace JB, Prugh LR (2017) Fatal Attraction? Intraguild Facilitation and Suppression among Predators. The American Naturalist 190: 663–679.
Smith DW, Peterson RO, MacNulty DR, Kohl M (2016) The Big Scientific Debate: Trophic Cascades.
Soria CD, Pacifici M, Di Marco M, Stephen SM, Rondinini C (2021) COMBINE: a coalesced mammal database of intrinsic and extrinsic traits. Ecology 102: e03344.
Soulé ME, Bolger DT, Alberts AC, Wrights J, Sorice M, Hill S (1988) Reconstructed Dynamics of Rapid Extinctions of Chaparral‐Requiring Birds in Urban Habitat Islands. Conservation Biology 2: 75–92.
University of Minnesota Natural Resources Research Institute (2025) Wolf (Canis lupus). https://mnmammals.d.umn.edu/wolf
USFWS (2016) A Review and Evaluation of the Red Wolf (Canis rufus) Historic Range, Final Report. US Fish and Wildlife Service.
USFWS (2020) Red Wolf Recovery Area.
Van Den Bosch M, Beyer DE, Erb JD, Gantchoff MG, Kellner KF, MacFarland DM et al. (2022) Identifying potential gray wolf habitat and connectivity in the eastern USA. Biological Conservation 273: 109708.
Vilaça ST, Donaldson ME, Benazzo A, Wheeldon TJ, Vizzari MT, Bertorelle G, Patterson BR, Kyle CJ (2023) Tracing Eastern Wolf Origins From Whole-Genome Data in Context of Extensive Hybridization (R Nielsen, Ed). Molecular Biology and Evolution 40: msad055.
Villeneuve K, Proulx G, Brook R (2022) Re-thinking wild canid management in northcentral Alberta to control a wild pig (Sus scrofa) invasion. Canadian Wildlife Biology & Management 11: 17.
vonHoldt BM, Aardema ML (2020) Updating the Bibliography of Interbreeding among Canis in North America (W Murphy, Ed). Journal of Heredity 111: 249–262.
vonHoldt BM, Cahill JA, Fan Z, Gronau I, Robinson J, Pollinger JP, Shapiro B, Wall J, Wayne RK (2016) Whole-genome sequence analysis shows that two endemic species of North American wolf are admixtures of the coyote and gray wolf. Science Advances 2: e1501714.
Weber W, Rabinowitz A (1996) A Global Perspective on Large Carnivore Conservation. Conservation Biology 10: 1046–1054.
Webster SC, Hinton JW, Chamberlain MJ, Murphy, JJ, Beasley JC (2024) Land cover and space use influence coyote carnivory: evidence from stable-isotope analysis. PeerJ, 12: p.e17457.
Weckel M, Bogan DA, Burke RL, Nagy C, Siemer WF (2015) Coyotes Go “Bridge and Tunnel”: A Narrow Opportunity to Study the Socio-ecological Impacts of Coyote Range Expansion on Long Island, NY Pre- and Post-Arrival.
Willson MF (1993) Mammals as Seed-Dispersal Mutualists in North America. Oikos 67: 159.
Wolf C, Ripple WJ (2017) Range contractions of the world’s large carnivores. Royal Society Open Science 4: 170052.
Wydeven AP, Wiedenhoeft JE, Schultz RN, Thiel RP, Jurewicz RL, Kohn BE, Van Deelen TR (2009) History, Population Growth, and Management of Wolves in Wisconsin. In: Wydeven AP, Van Deelen TR, Heske EJ (eds) Recovery of Gray Wolves in the Great Lakes Region of the United States, 87–105. Springer New York, New York, NY.
Accepted by 5 of 5 reviewers
Open Access
Peer-Reviewed
Creative Commons
Submitted: 30 September 2024
Accepted: 17 June 2025
Published: 14 August 2025
There is no funding associated with this study.
Conflicts of Interest:
The author declares no conflicts of interest.


