

Modeling groundwater contributing areas to Florida springs: spatiotemporal variability and pumping effects on springshed boundaries
CC: https://orcid.org/0000-0001-7362-2810
Cortney R. Cameron. (2025). Modeling groundwater contributing areas to Florida springs: spatiotemporal variability and pumping effects on springshed boundaries. Stacks Journal: 25009. https://doi.org/10.60102/stacks-25009

Abstract photo. Manatees overwintering in a Florida spring.
Abstract
Freshwater springs are of outsized ecological and cultural importance but increasingly threatened by human activities. Unlike fixed watershed boundaries, springshed boundaries fluctuate with groundwater level conditions. Accurate springshed delineation supports regulatory programs aimed at protecting springs, but limited work has quantified how springsheds vary over time. Central Florida provides an ideal case study for examining this variability due to its high density of springs and the availability of a well-calibrated regional groundwater model. This study investigates the spatiotemporal variability of springsheds for five Outstanding Florida Springs (Alexander, Rainbow, Silver, Silver Glen, and Wekiva) using 13 years of monthly potentiometric surfaces from a regional groundwater model. An automated delineation method was used to analyze springshed boundaries over time, leveraging model scenarios with and without groundwater pumping. Springshed areas fluctuated substantially about their means across the study period. Regional groundwater withdrawals influence springshed areas differently across systems but with generally modest effects. Core springshed areas remained relatively stable regardless of pumping conditions, while peripheral boundaries exhibited greater temporal variability. Regardless of pumping status, overall springshed extents overlap considerably, with this dynamic especially notable for Silver and Rainbow. Overall, the findings support the need to incorporate expert knowledge in springshed delineation and to consider time-varying, interconnected springshed boundaries in regional regulatory frameworks.
Keywords: groundwater modeling, groundwater withdrawals, hydrogeology, karst, potentiometric surfaces, springsheds
Introduction
Sitting at the interface of groundwater, surface water, and terrestrial ecosystems, freshwater springs are of outsized ecological and cultural importance but increasingly threatened by human activities (Barquín & Scarsbrook, 2008, Hunter et al., 2017, Stevens et al., 2021). This pattern can be seen around the world, from arid deserts to snow-capped mountains. Mound springs in Australia’s Great Artesian Basin serve as critical refugia for endemic species, but groundwater use has dramatically reduced flows (Fairfax & Fensham, 2003). High-elevation springs in the European Alps support specialized cold-stenothermic species but are being lost to changes in temperature, precipitation, and development (Cantonati et al., 2006).
With hundreds of springs, including over 25 first magnitude systems, Florida serves as another prime example of this conflict (Scott et al., 2004). Springs generate millions of dollars for local economies and provide critical winter habitat for manatees, a threatened marine mammal species (Laist et al., 2013, Wynn et al., 2014). However, the Floridan aquifer, the extensive karst system from which springs derive flows, serves as the state’s main water supply source and can be vulnerable to surface nutrient loading (Scott et al., 2004). Between the 1960s and 2010s, statewide groundwater withdrawals quadrupled (Marella, 2020), while precipitation has generally been lower (Rouse Holzwart et al., 2017, Sutherland et al., 2017, Cameron et al., 2020). Accordingly, many Florida springs show long-term flow declines (Work, 2020, Copeland & Woeber, 2021), although the relative contributions of pumping versus precipitation to spring flow declines are debated. Groundwater modeling, which can isolate withdrawal impacts by comparing scenarios with and without groundwater pumping, generally projects pumping-driven declines at select Florida springs as less than 10 percent by 2040 (SWFWMD, 2020, SJRWMD, 2022). This is much lower than observed declines suggest but still enough to meet regulatory criteria for “significant harm” at some systems.
Given growing public interest in pressures facing springs, various state regulatory efforts have sought to protect spring water quality and quantity, such as basin management action plans and minimum flows and levels (Florida Statutes, 373.807 and 373.042). To spatially constrain relevant management actions, many regulatory programs utilize springshed boundaries (e.g., FDEP, 2013). A springshed comprises all areas that contribute to groundwater that discharges from the spring (Scott et al., 2004). An understanding of springshed area is also necessary to develop water budgets, which can be used to understand hydrologic fluxes and verify groundwater model results (e.g., Rouse Holzwart et al., 2017). Incorrect delineation can result in erroneous inclusion or exclusion of major groundwater withdrawals or contaminant sources.
Unlike watershed boundaries, which are typically defined by fixed physical features, springshed boundaries fluctuate with groundwater level conditions, which vary with precipitation and withdrawals (Scott et al., 2004, FDEP, 2013). Methods to delineate springsheds include potentiometric mapping, chemical studies, groundwater model particle tracking, aquifer structural mapping, and temperature and discharge monitoring (Knowles et al., 2002, Phelps, 2004, Shoemaker et al., 2004, Alexander et al., 2008, Walsh et al., 2009, Green et al., 2014, Ghosh et al., 2016, Smith et al., 2020, Gao et al., 2022, Barry et al., 2023), all having advantages and weaknesses. Potentiometric methods are limited by map accuracy and resolution, particle tracking by model accuracy, and dye-based methods by chemical losses or excessive travel times (Scott et al., 2004). Model-based methods may be improved by using ensemble approaches that consider areas that overlap among multiple models (Shoemaker et al., 2004, Munch et al., 2007).
In Florida, springshed delineation is further challenged by its karst hydrogeology, with variable flowpaths, large conduits, heterogeneous transmissivity, and relatively flat potentiometric gradients (Cohen, 2008, Kincaid et al., 2014). Given relatively high groundwater data density in many parts of the state, the lower-cost potentiometric-based approach is probably the most widely used across Florida as a whole (e.g., Bartel et al., 2011, FDEP, 2013, Bridger et al., 2017, Harris et al., 2017, Rouse Holzwart et al., 2017). However, in some regions, geological structures such as escarpments and significant swallet systems influence springsheds, so potentiometric data alone may not be sufficient for reliable delineations (Upchurch & Champion, 2004). Thus, other approaches are employed depending on management needs, data availability, and hydrogeologic setting (e.g., Kincaid et al., 2012, Sutherland et al., 2017). A limited number of Florida springs have springsheds defined using travel times (e.g., Silver Springs, Sutherland et al., 2017).
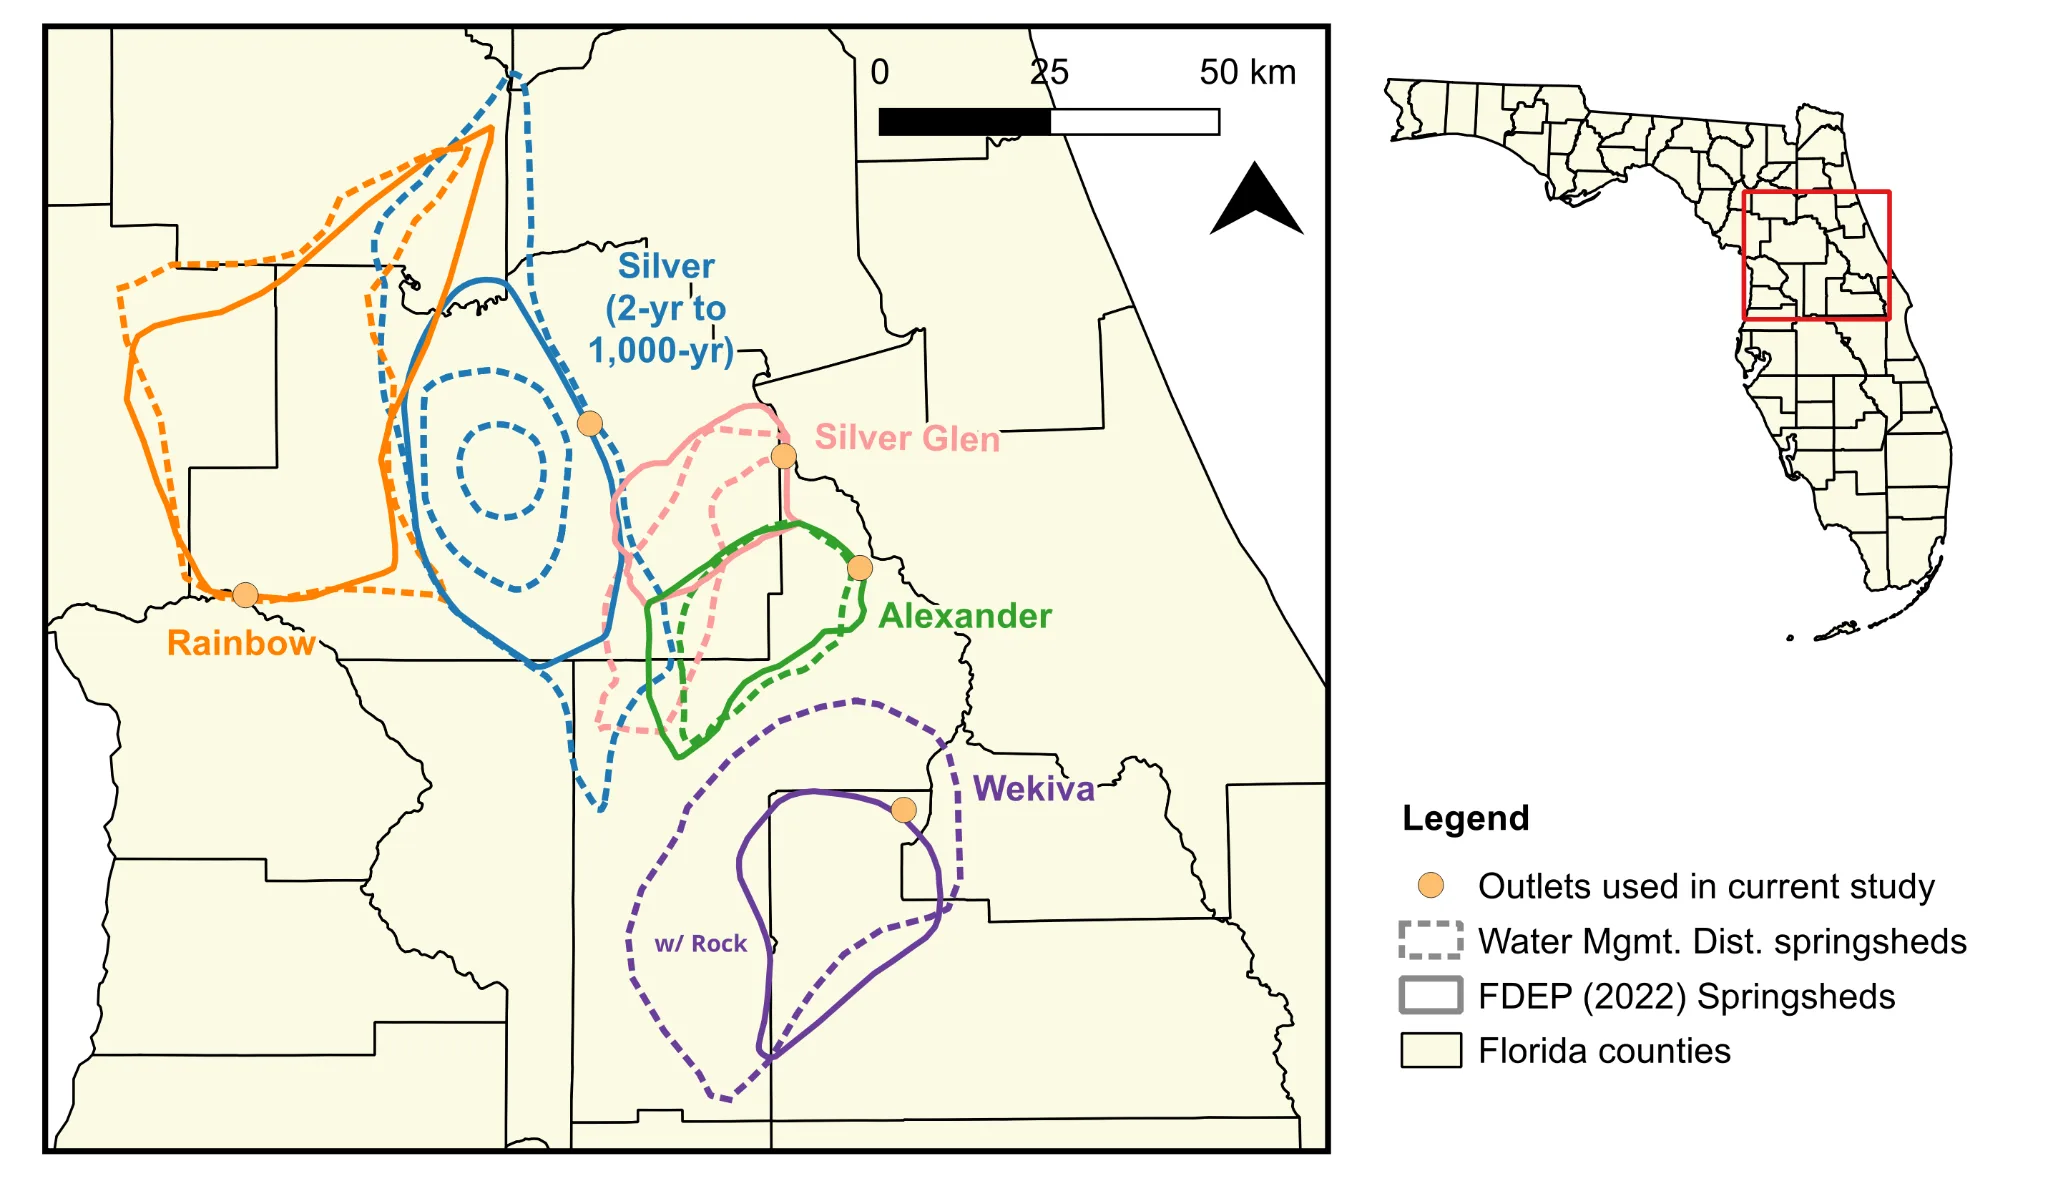
Accordingly, springsheds can differ considerably between sources due to variable methods, time periods, and interpretations (Fig. 1). The challenge of springshed delineation became a point of technical debate during the establishment of minimum flows and levels for the Rainbow River (Rouse Holzwart et al., 2017), a first-magnitude Outstanding Florida Spring (Florida Senate Bill 552, 2016). Regulators considered the springshed relatively consistent, with areas fluctuating within about 10% of the mean based on selected potentiometric (groundwater elevation) surfaces for the Upper Floridan aquifer (Rouse Holzwart et al., 2017). However, peer reviewers noted that delineation was especially difficult given the nearly flat potentiometric gradient at the boundary with the Silver River springshed (Cohen et al., 2016), which has varied over time (Kincaid & Meyer, 2013, FDEP, 2013, Ghosh et al., 2016). This springshed variability reflects responses to hydrologic conditions, where pumping and rainfall affect the balance between adjacent springs; drier conditions favor the lower-elevation Rainbow Springs relative to Silver Springs (WSI, 2013). Illustrative of tensions around springs management, the minimum flows proposal for Rainbow was legally challenged (Florida Division of Administrative Hearings, Case No. 19-002517RP).
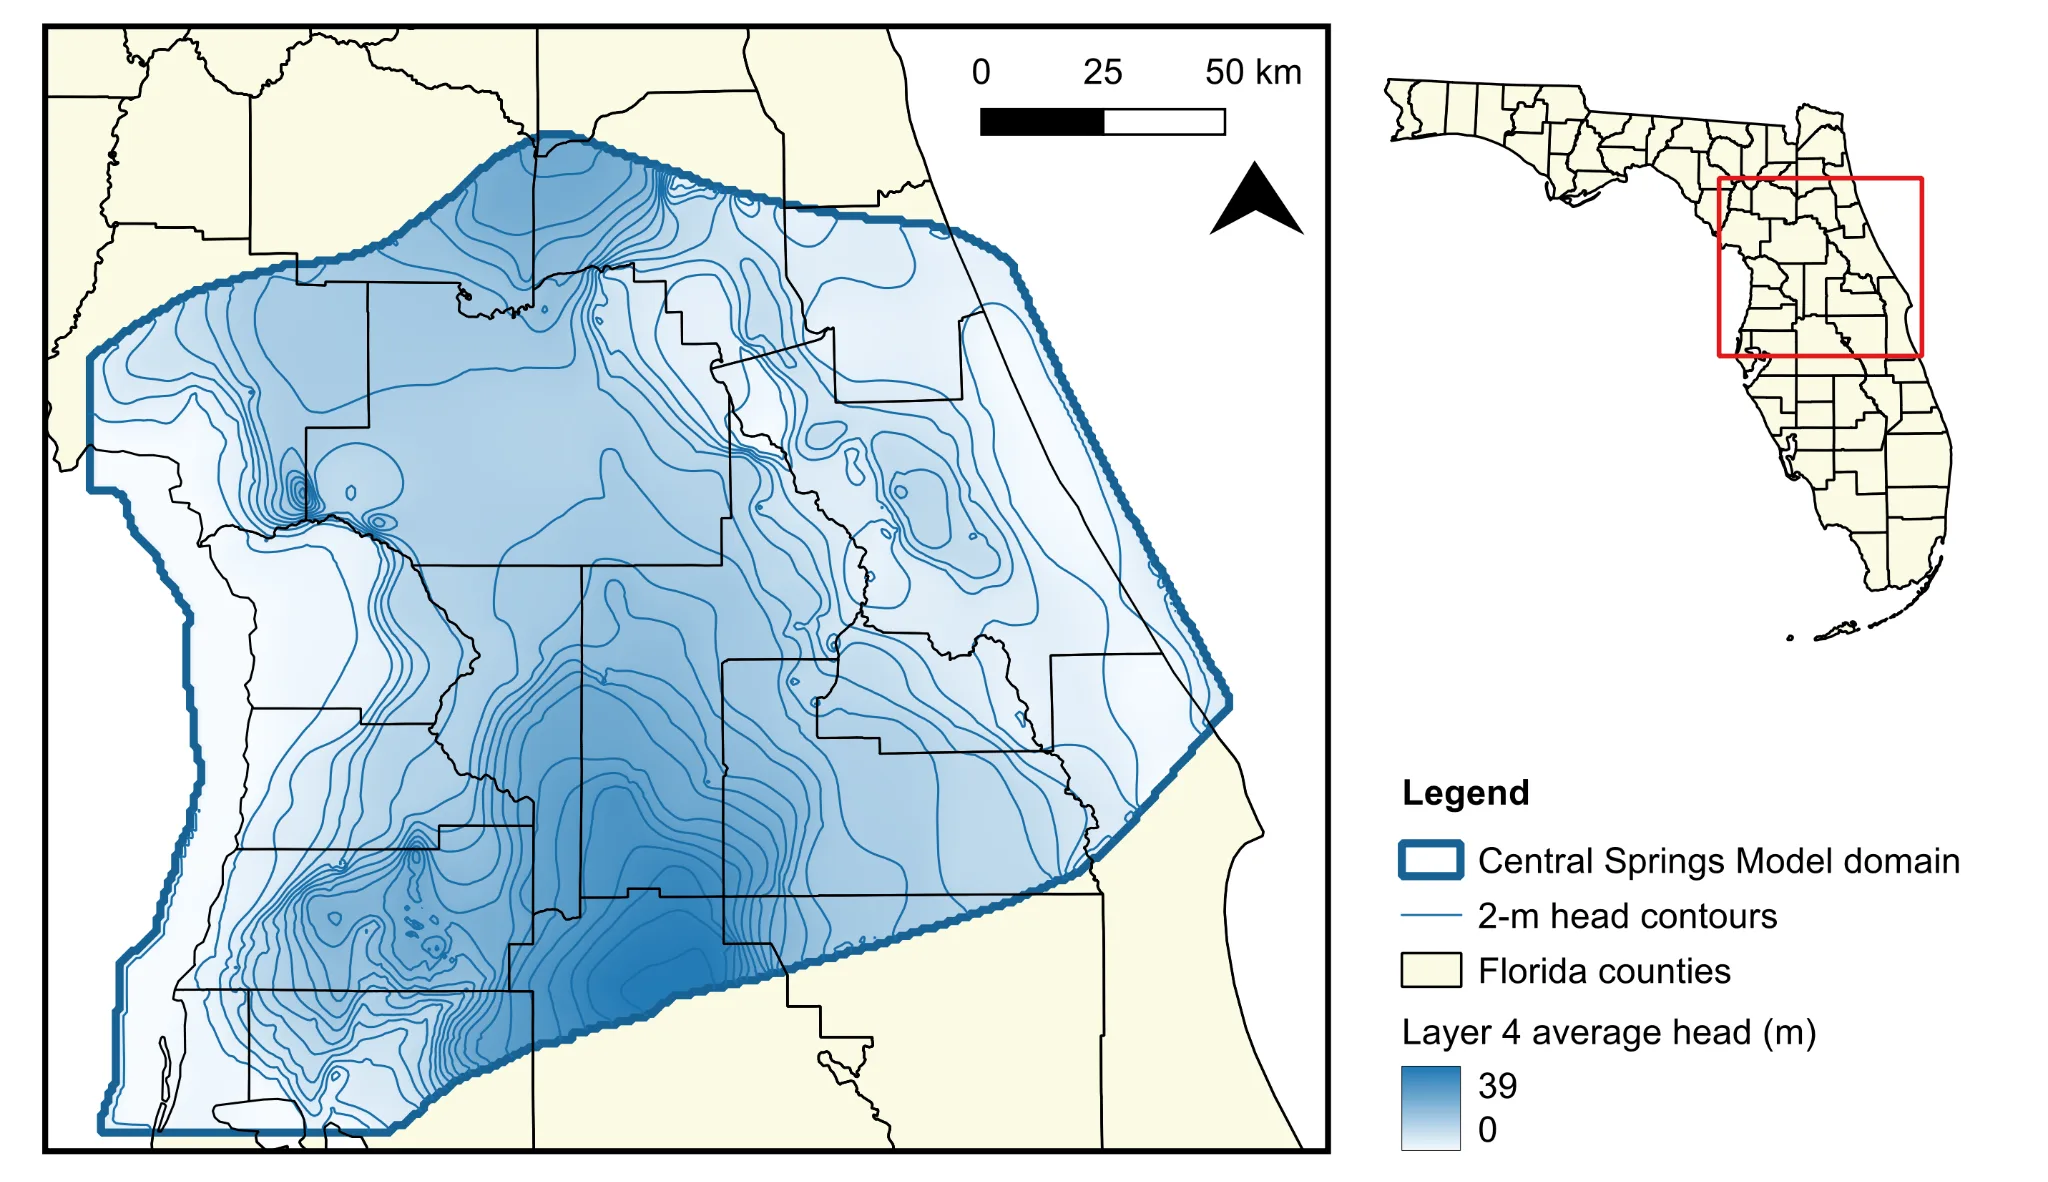
As part of continuing efforts to understand groundwater withdrawal effects on springs and regional hydrology, the peer-reviewed Central Springs Model (Fig. 2) was completed in 2024 by the St. Johns River Water Management District and the Southwest Florida Water Management District, two regional regulatory agencies (Sun et al., 2024). The development of this sixth-generation model, which incorporates recent advances in local hydrogeologic understanding, suggests a way forward for enhanced assessments of spring hydrology in central Florida.
As existing studies exploring Florida springshed variability are limited and typically focus on one spring (e.g., FDEP, 2013, Rouse Holzwart et al., 2017), the Central Springs Model provides a unique opportunity to evaluate springshed variability for several of Florida’s largest springs using a consistent dataset, methodology, and time period. Accordingly, the main objective of this study is to evaluate a simple automated process for springshed delineation using monthly modeled potentiometric surfaces. The results quantify springshed spatiotemporal variability and demonstrate the interrelatedness of adjacent springsheds, while evaluating the utility and limits of automated delineation using modeled potentiometric surfaces. These findings could improve management approaches by better documenting springshed spatiotemporal variability, supporting the need for adaptive regulatory approaches.
Methods and Materials
Study area and springs selection
Five Outstanding Florida Springs systems were selected for analyses based on their occurrence within the Central Springs Model domain and their potential to be delineated from modeled potentiometric surfaces: Alexander, Rainbow, Silver, Silver Glen, and Wekiva (Fig. 1). Coastal systems and springsheds where significant portions of boundaries are mainly structurally defined (e.g., by large rivers) were not considered appropriate for the current study. Extremely flat potentiometric gradients at the coast (Fig. 2) result in unreliable automated delineations, while delineations that rely on structure do not always align with potentiometric-based approaches (e.g., springsheds drawn for Homosassa usually use the Withlacoochee River as a boundary, although this could underestimate the true groundwater contributing area; Leeper et al., 2012).
The five assessed springs are all located in central Florida within a subtropical karst setting that averages approximately 140 cm of annual rainfall (Scott et al., 2004, Freese & Sutherland, 2017, Harris et al., 2017, Rouse Holzwart et al., 2017, Sutherland et al., 2019, Sutherland et al., 2024). Direct runoff is generally a minor contributor to flows at most of these systems (Freese & Sutherland, 2017, Harris et al., 2017, Rouse Holzwart et al., 2017, Sutherland et al., 2019).
For each spring system, a springshed groundwater “outlet” was defined based on review of existing delineations (Fig. 1), potentiometric surfaces from the Central Springs Model (Fig. 2), and hydrography layers showing confluences with larger waterbodies. This approach allows the delineation to capture the full groundwater contributing area to the spring system rather than only areas feeding individual vents.
Central Springs Model
The Central Springs Model covers central Florida from coast to coast (Fig. 2) and is fully described in Sun et al. (2024). The model, which utilizes the MODFLOW-NWT code, is discretized using a 762-m grid and 7 layers. The model includes calibrated steady-state (2005 to 2018 average) and monthly transient (2006 to 2018) versions.
Transient model calibration matched observed first magnitude springflows within 5% and most second magnitude springs within 10%. Mean absolute error for groundwater elevations was less than 0.8 m at 83% of Upper Floridan aquifer wells. While the model calibration focused on matching observed flows and water levels, calibration did not explicitly validate springshed boundaries. Despite inherent limitations, the Central Springs Model provides a standardized spatial grid and temporal resolution to facilitate systematic comparison of springshed variability among multiple springs. This enables analyses that would not be feasible with spatially and temporally incomplete observational data that varies in coverage among springs.
For this study, monthly groundwater level (head) data were acquired for 2006 to 2018 from the calibrated transient Central Springs Model (version 1.0) for layer 4. Layer 4 represents the Upper Floridan aquifer and is used in the model for spring drain placement (Sun et al., 2024). The first stress period in the transient model is a steady state representation of 2005 average conditions, which serves as a warmup period and was not included in analyses.
Two scenarios were assessed: pumps on (with groundwater pumping) and pumps off (without groundwater pumping). The pumps-on calibrated model represents best efforts to characterize actual groundwater withdrawals and injections throughout the domain during the modeled time period (Sun et al., 2024). The pumps-off scenario was conducted using input files that do not include withdrawals. The pumps-off input files were developed by the water management district and are included with the Central Springs Model package. The pumps-off scenario includes more uncertainty than the calibrated pumps-on scenario, as it represents hypothetical conditions not directly validated against observed data.
Model output processing
For each of 156 months per scenario, the following workflow was applied: (1) heads were rasterized, (2) drainage direction and flow (stream) segment rasters were generated using the GRASS GIS (version 8) r.watershed algorithm, (3) spring outlets were snapped to the geometrically nearest flow segment, and then (4) springshed basins were calculated using the GRASS r.water.outlet algorithm (GRASS Development Team, 2025). The R language (version 4.2) was used for analyses and as a wrapper for QGIS (version 3.30.2) and GRASS functions (QGIS Development Team, 2023, R Core Team, 2024). Any surface features, including swallets, contributing to springflows were assumed to fall within the springshed delineated from the modeled potentiometric surface.
Erroneous delineations can result from imperfect outlet snapping where the algorithm inappropriately assigns spring outlets to nearby upstream flow segments, capturing only partial contributing areas. Delineation issues can also arise from time-varying accuracy of head layers and flat gradients that challenge flow segment generation and flow accumulation, resulting in assignment of inappropriately small or large areas to the outlet. Therefore, outlier months were removed from analyses. Outliers were defined for each spring system as months where the springshed area fell more than 1.5 times the interquartile range outside the lower and upper quartiles (Tukey, 1977). Between 0 and 31 months were removed across all springs and both scenarios, with a median of 7 months removed (tables of removed months are available at the link in the Data Availability Statement).
Statistical analyses
For each springshed and scenario, several metrics were calculated to characterize spatiotemporal variability. Mean springshed area was determined by averaging monthly values across the study period after outlier removal (Table 1). Standard deviation was used to express variability around this mean, reported as ±2 standard deviations.
To characterize spatial variability of springshed boundaries, the proportion of months each cell was included in each springshed was calculated (Figs. 3-4). Overall extent was defined by the union of all monthly springsheds, representing any cell included in the springshed during at least one month. Overall extent differs from maximum area since no single month achieved the complete overall extent. Median extent was defined as areas that appeared in the springshed in at least 50% of months, representing a persistent configuration.
To assess withdrawal influences on springshed boundaries, spatial differences between the pumps-on and pumps-off scenarios were computed and visualized (Fig. 4b-f). To statistically assess these differences, monthly areas between scenarios were compared using paired Wilcoxon (1945) signed-rank tests (Fig. 5). This non-parametric statistical test compares two groups by ranking pairwise differences from smallest to largest, then comparing the sums of positive versus negative ranks. An alpha level of 0.05 was used.
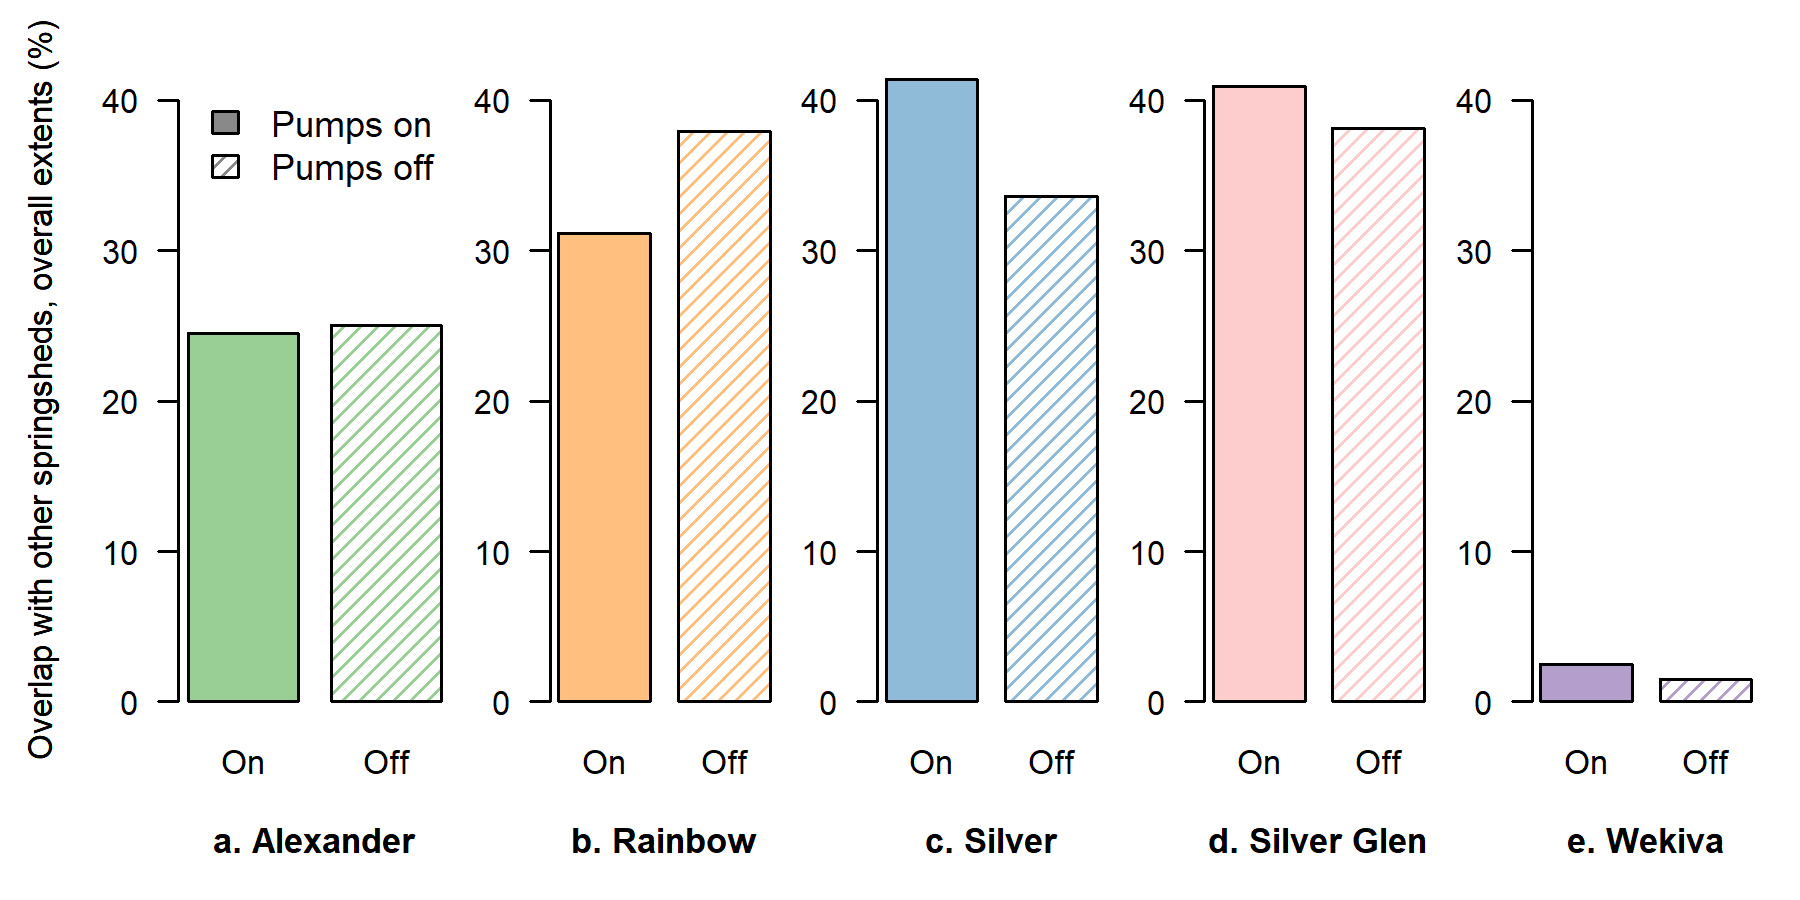
Finally, for each springshed, the percentage of overall extent that overlapped with other study springsheds was assessed (Fig. 6).
Results
For the pumps-on scenario, springshed area fluctuation about the mean ranged from 5 to 22%, smallest at Wekiva and largest at Rainbow (Table 1, Fig. 3, Fig. 5a-e). For the pumps-off scenario, springshed area fluctuation about the mean was similar to pumps-on for all springs but Silver, where variability doubled compared to the pumps-on scenario (Table 1, Fig. 5a-e).
Comparing pumps-on and pumps-off scenarios, mean monthly springshed areas slightly increased under regional pumping conditions for Rainbow (+1.5%), while other systems decreased as much as 5.3% (Table 1, Fig. 4). Although median relative changes were also generally modest, all were statistically significant (Fig. 5f).
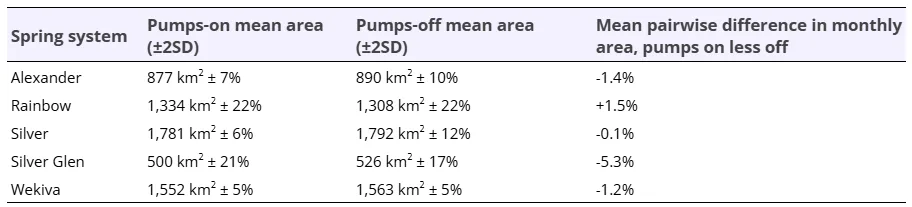
Table 1. Summary of springshed area results from 2006 to 2018.
Relative overlap of springshed overall extents was generally consistent between pumps-on and pumps-off scenarios but differed greatly among springs, ranging from 1% to 41% of area (Figs. 3-4, Fig. 6). At Silver, however, relative overlap was notably different between scenarios, with the pumps-off scenario showing 7 percentage points lower overlap. This difference resulted from the larger overall extent of the Silver springshed in the pumps-off scenario rather than changes in absolute overlap area (Fig. 4). Overlap was at least 24% at all springs but Wekiva, which was 1% to 2%.
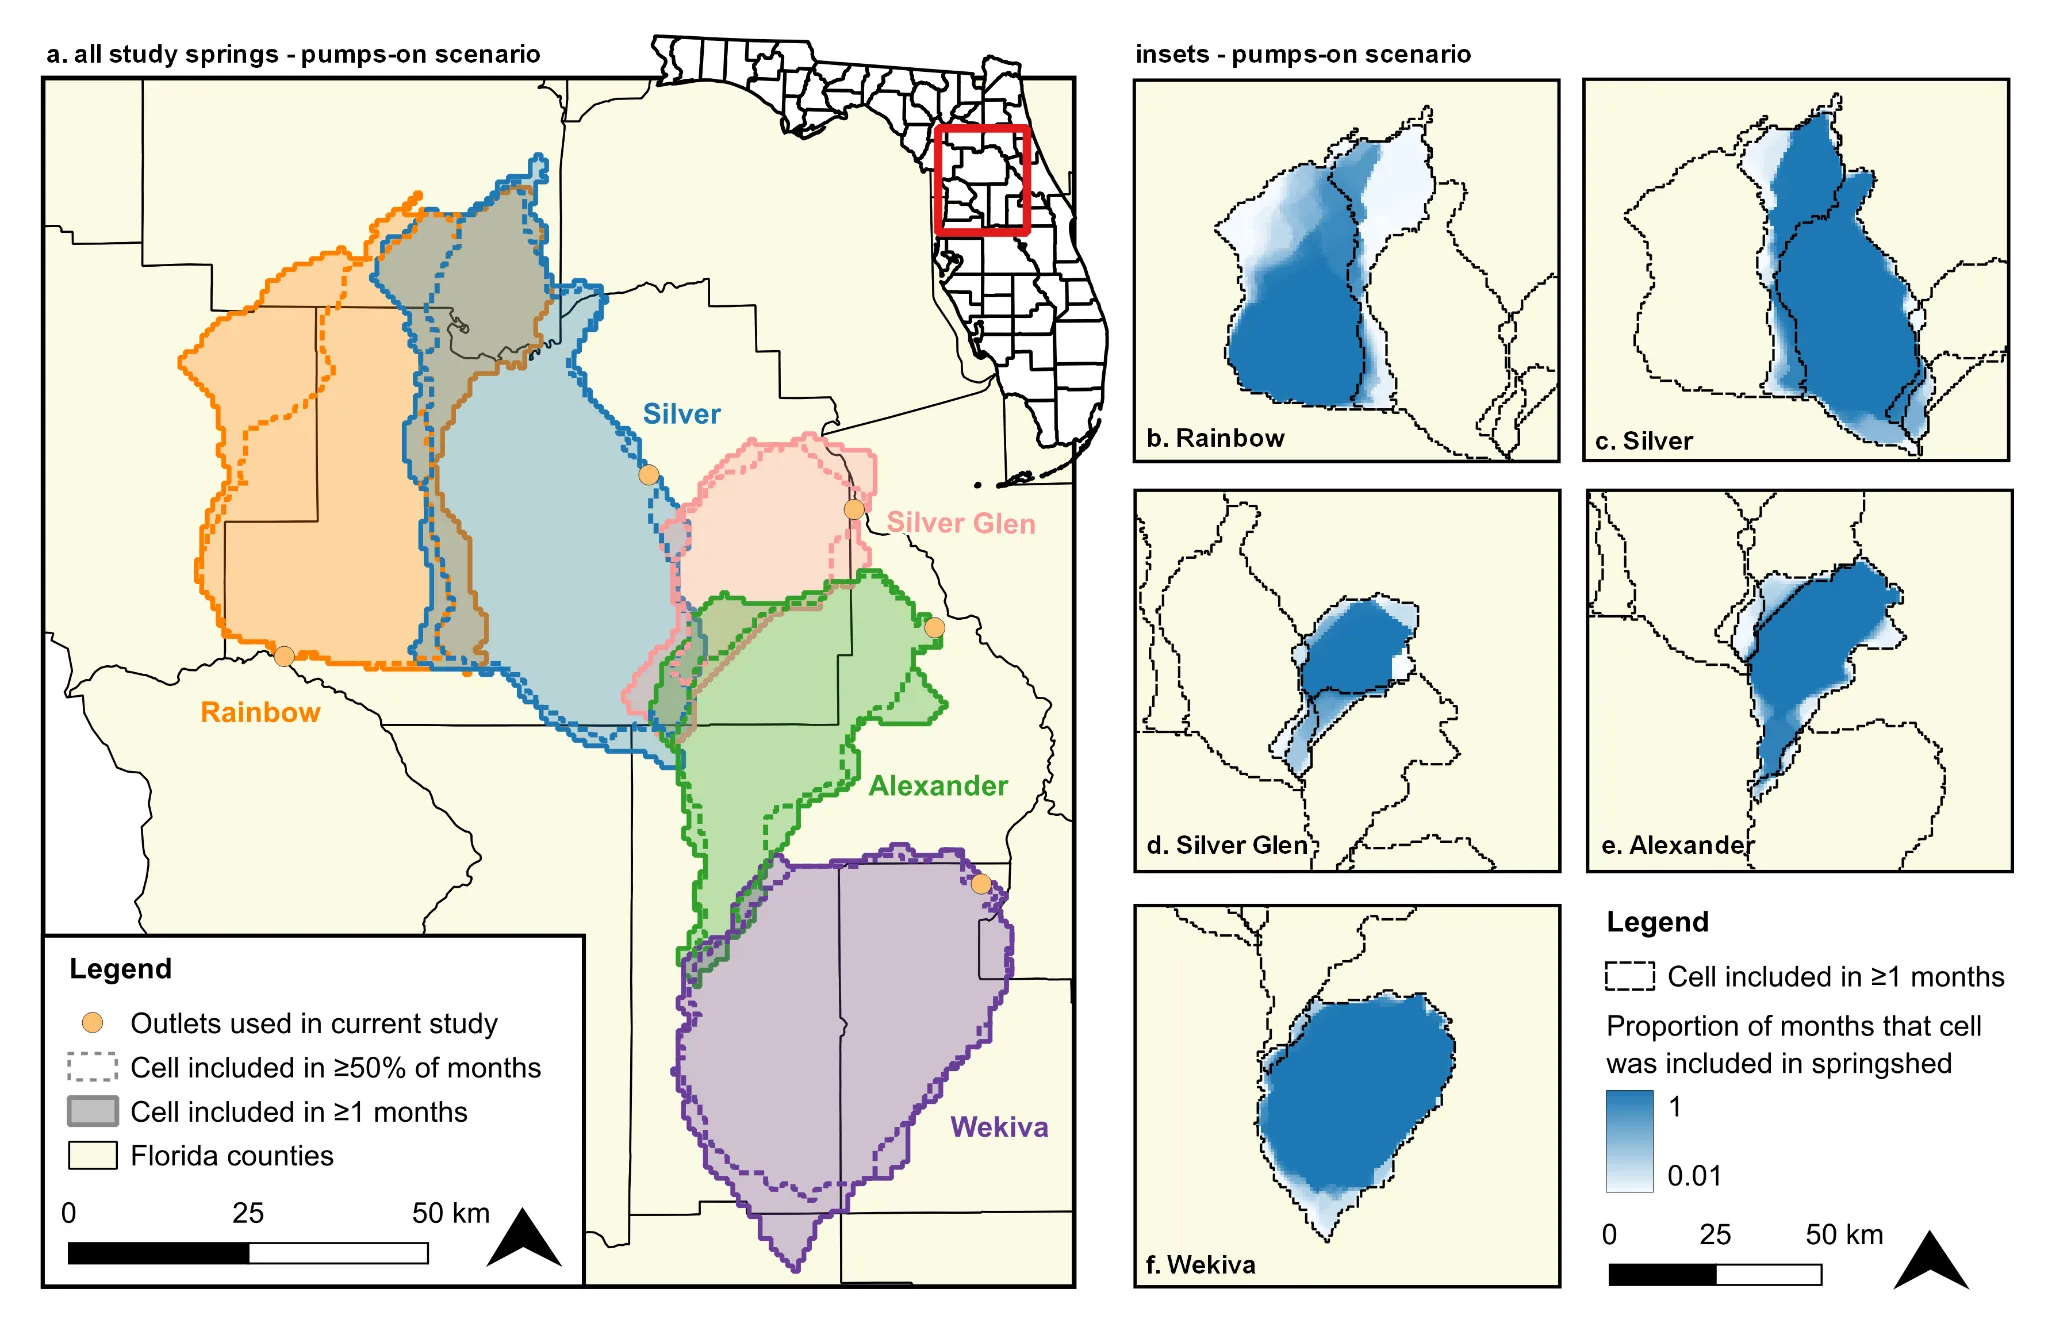
Figure 3. Maps of springsheds delineated from Central Springs Model pumps-on potentiometric monthly 2006 to 2018 surfaces showing (a) all five springsheds, with median and overall boundaries, and (b-f) insets of individual springsheds showing proportion of months each cell was included in springshed.
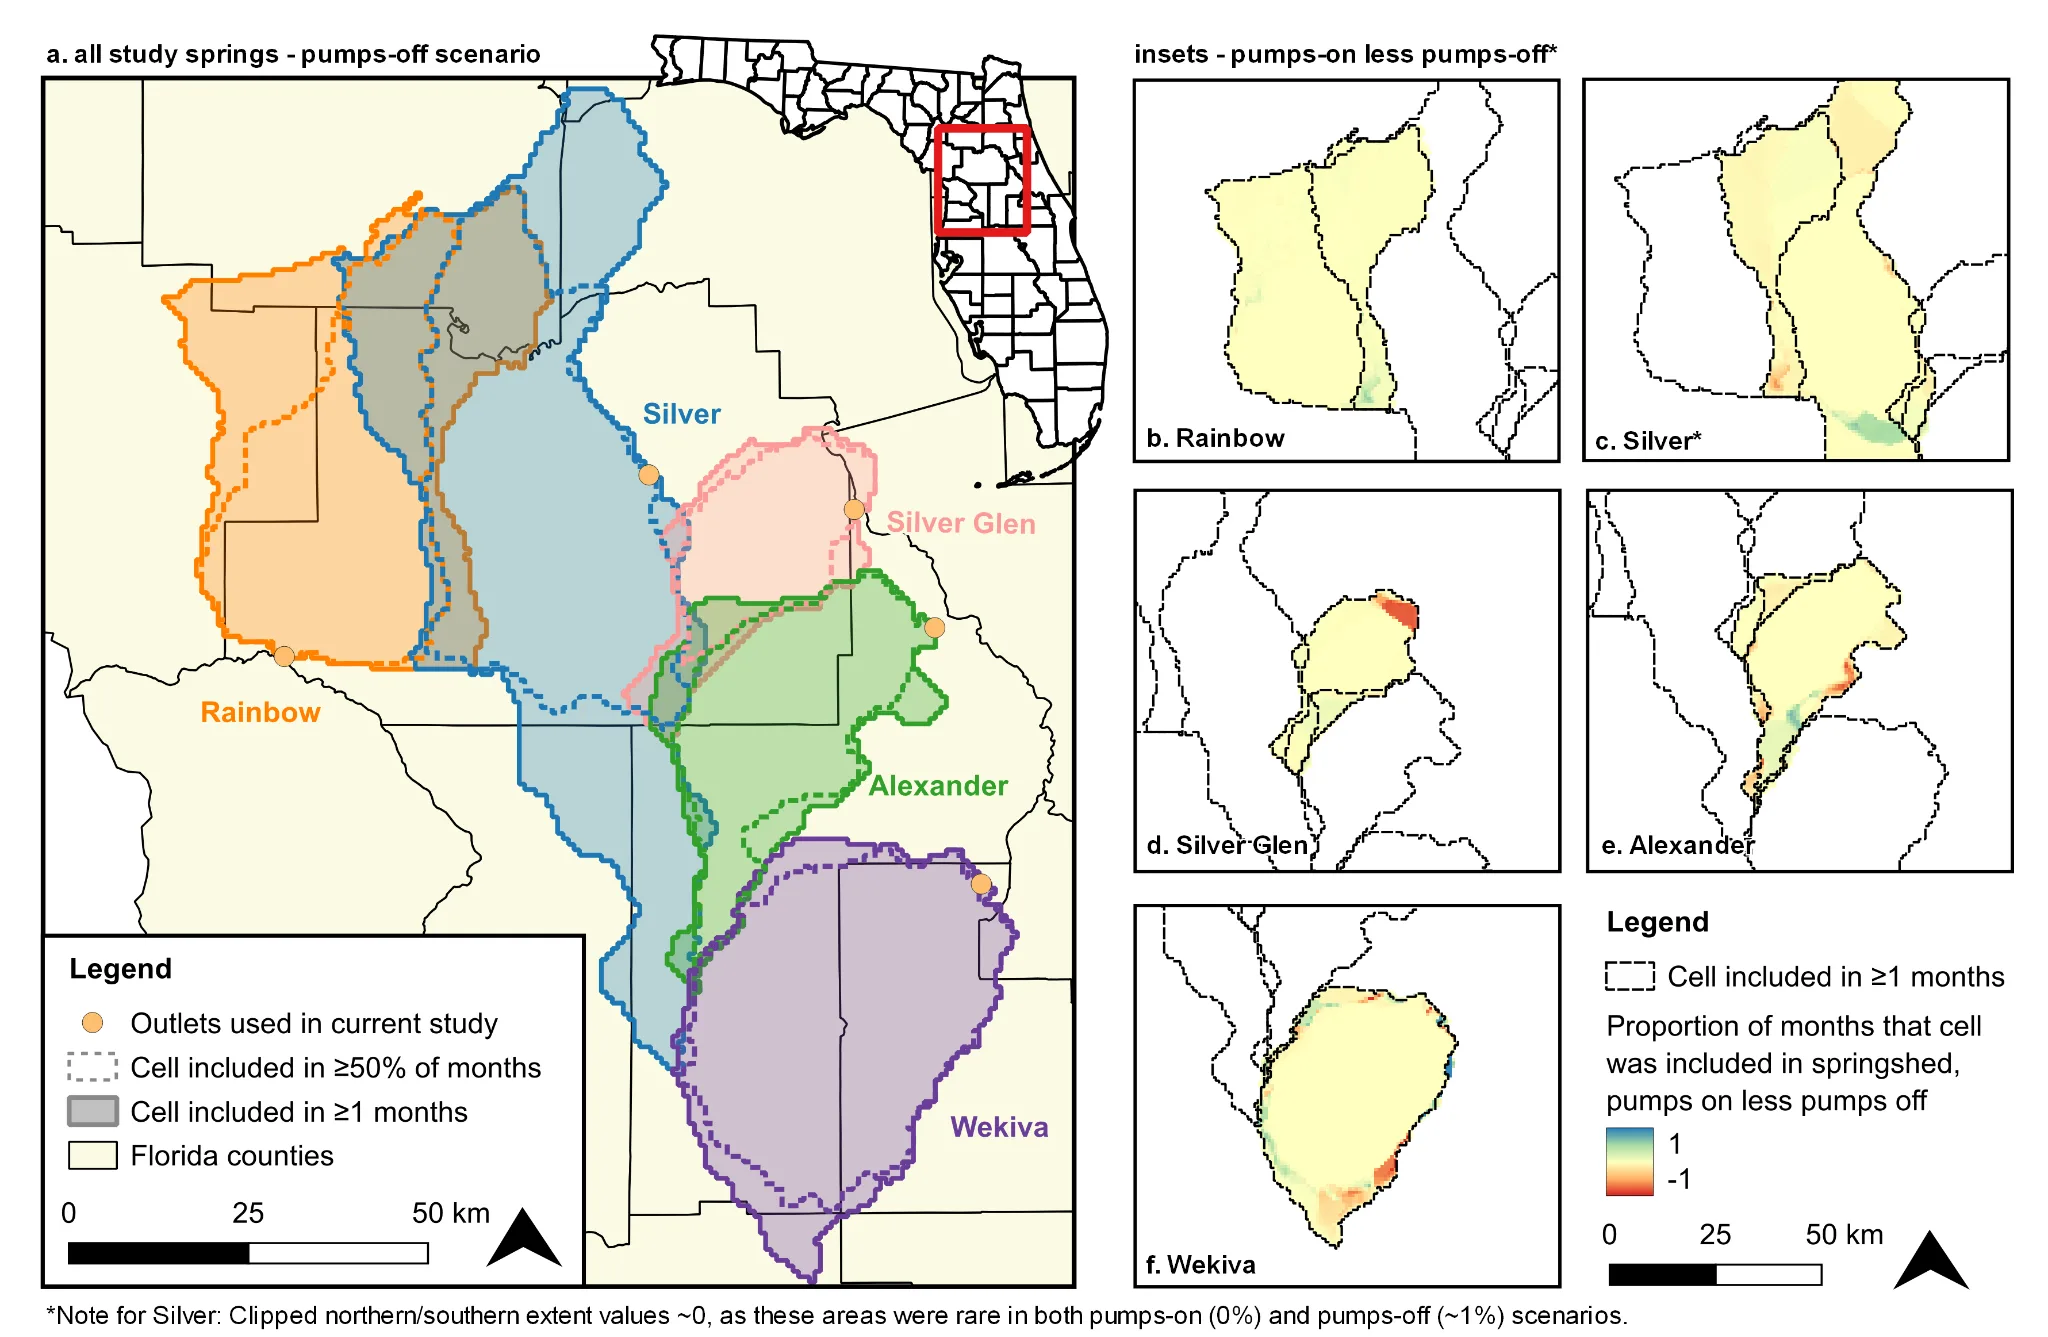
Figure 4. Maps of springsheds delineated from Central Springs Model pumps-on potentiometric monthly 2006 to 2018 surfaces showing (a) all five springsheds, with median and overall boundaries, and (b-f) insets of individual springsheds showing proportion of months each cell was included in springshed.
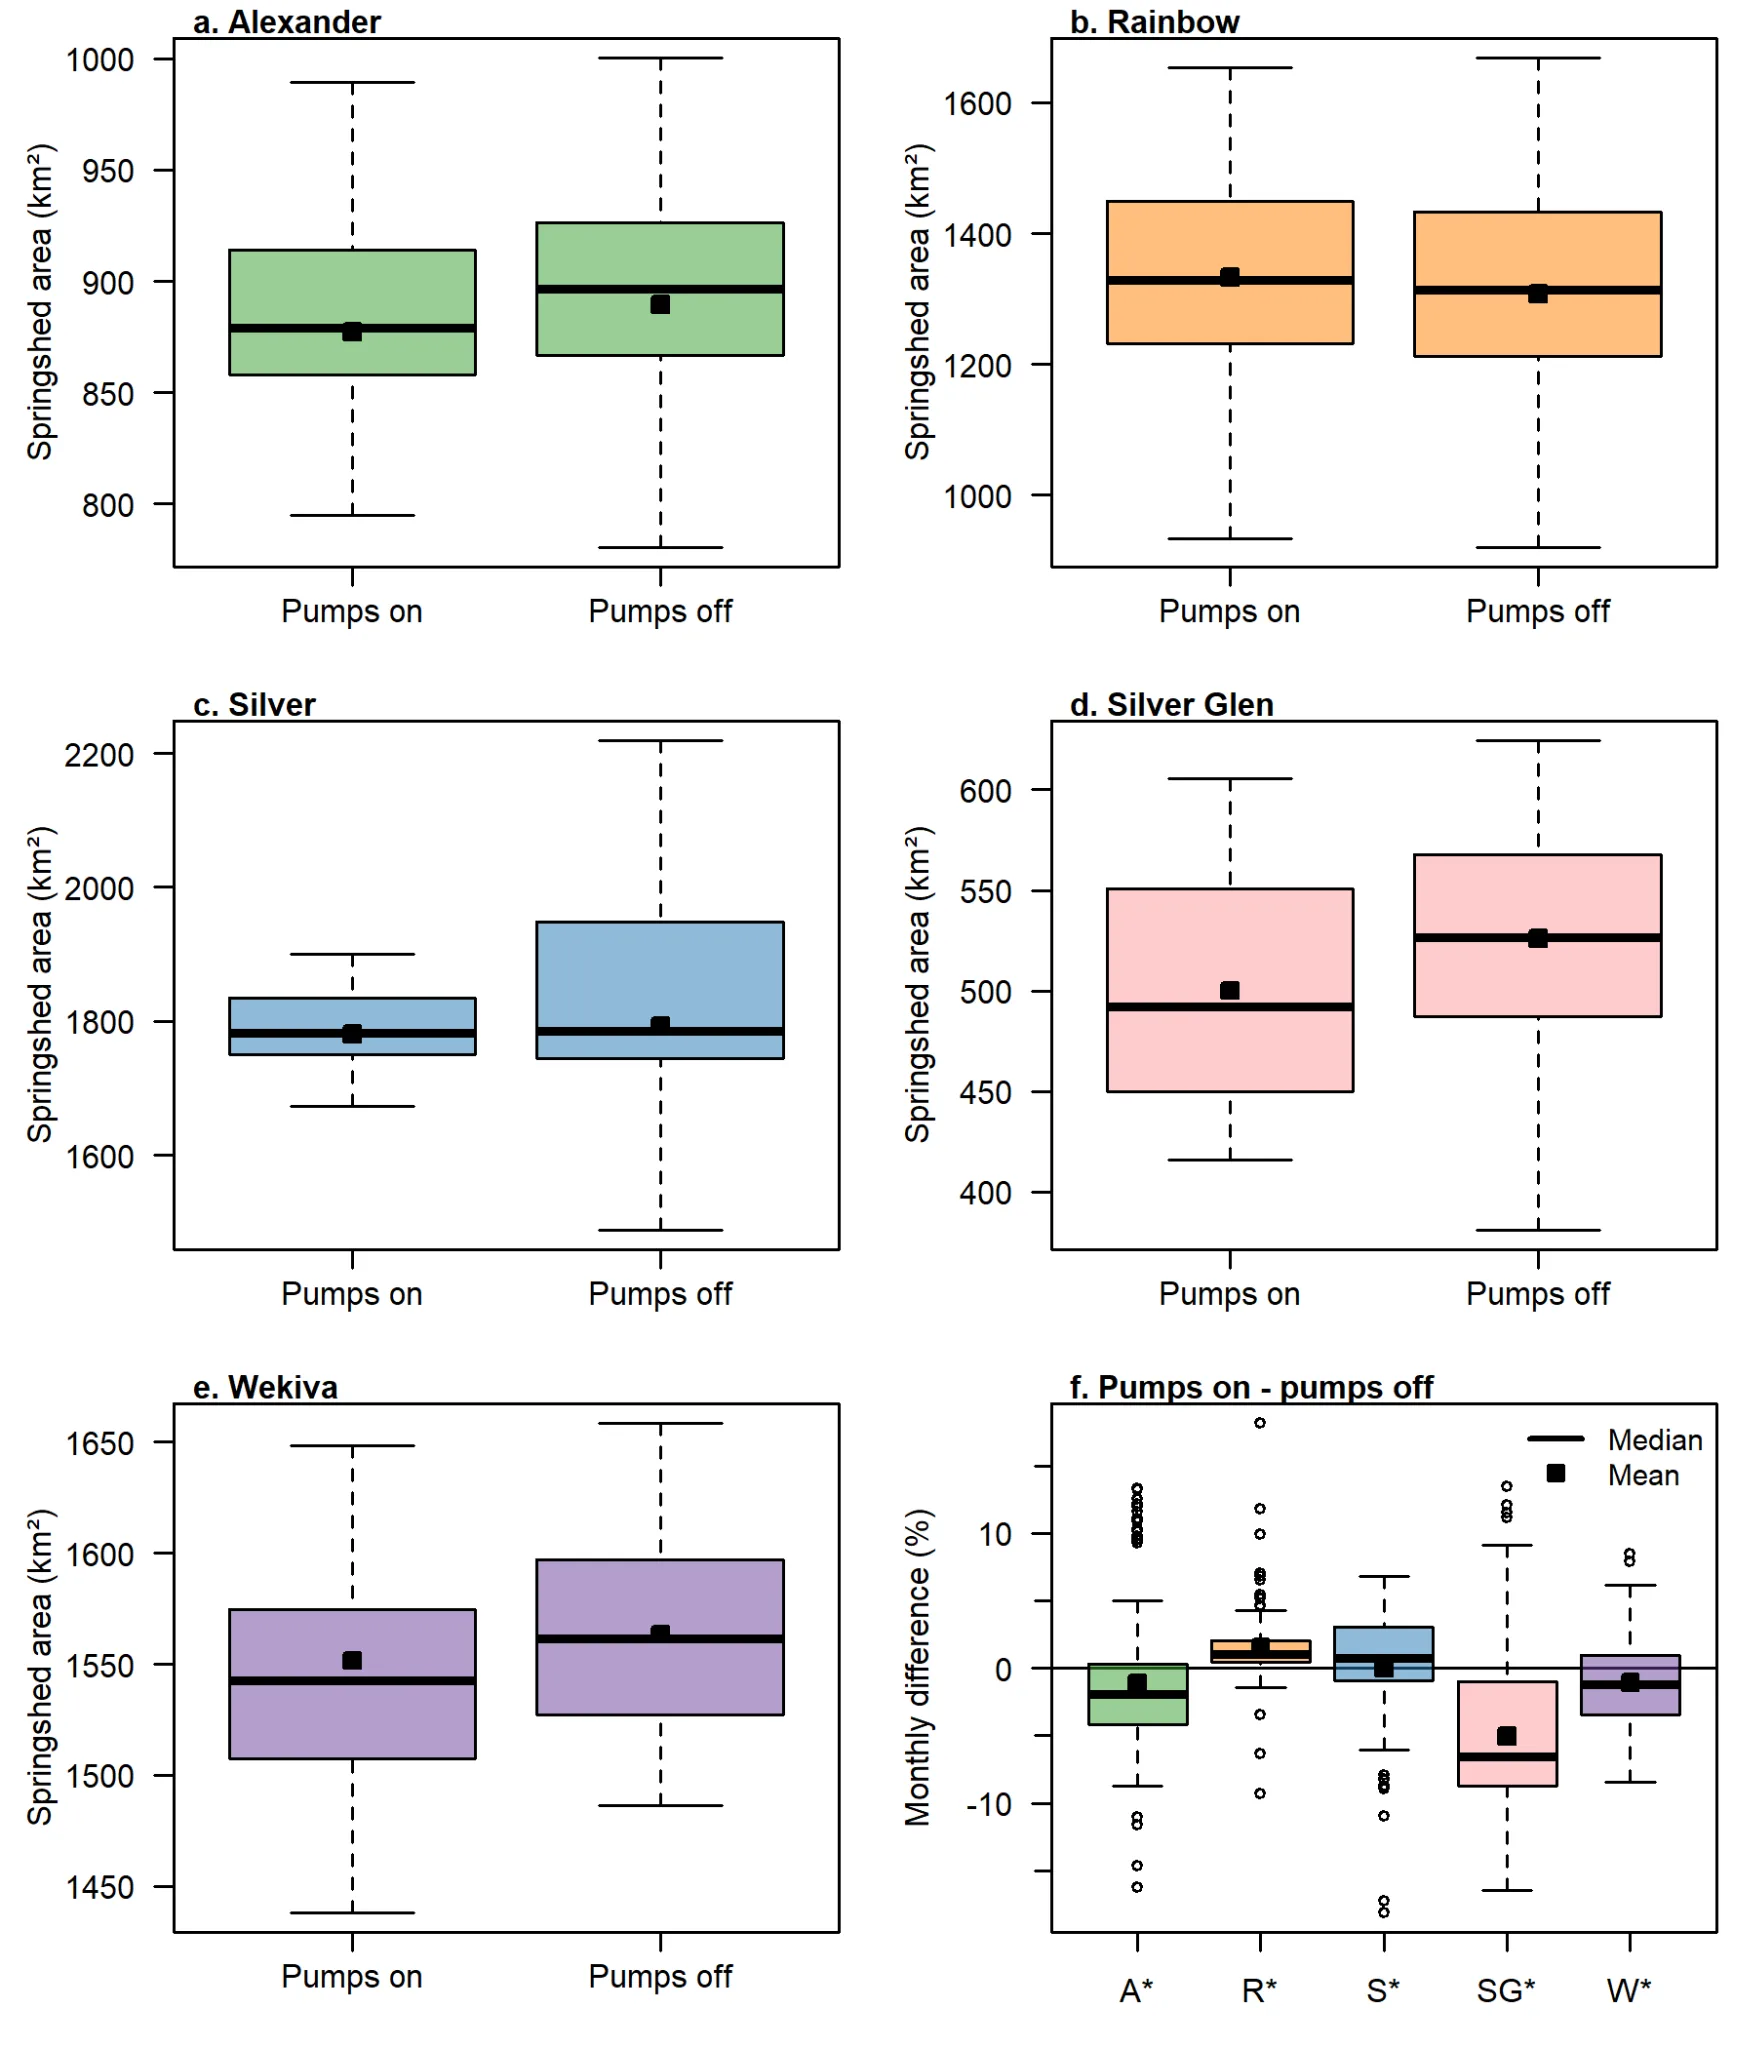
Figure 5. Boxplots of (a-e) individual springshed areas under pumps-on and pumps-off scenarios (outliers removed), and (f) pairwise area differences between scenarios (asterisk indicates significance of paired Wilcoxon test at α = 0.05), using Central Springs Model monthly potentiometric surfaces from 2006 to 2018.
Discussion
Comparison to previous work
This study applied an automated springshed delineation method using modeled outputs to evaluate the spatiotemporal variability of five major Florida spring systems. Based on qualitative visual comparison, resulting overall extents (Fig. 3) generally corresponded to areas and boundaries identified in previous studies (Fig. 1). This suggests existing delineations are reasonably conservative and capture a wide range of hydrologic conditions.
For Rainbow Springs, area fluctuation about the mean was twice as high as in Rouse Holzwart et al. (2017), which assessed a much smaller number of months. The increased variability in the current study mainly resulted from capturing lower springshed areas. Rainbow’s generally high variability compared to other systems could reflect differences in hydrogeology and pumping patterns; Rainbow is situated in an area with flatter potentiometric gradients where groundwater basin divides can move across larger distances as hydrologic conditions change.
Boundary stability and pumping effects
All springsheds showed considerable monthly variability (5% to 22% about mean area; Table 1). However, each maintained a relatively persistent core contributing area even as peripheral boundaries shifted with hydrologic conditions (Figs. 3-4).
While core springshed areas were relatively stable between pumping scenarios, all springs showed statistically significant monthly differences between pumps-on and pumps-off scenarios. Nevertheless, effect sizes were generally modest, with mean pairwise differences of ±5.3% or less. The high statistical power of the large temporal dataset allows detection of small differences that may not be practically meaningful depending on the application. Results also reflect model limitations, further discussed later. Higher uncertainty in the pumps-off scenario may explain increased pumps-off variability observed for some systems, such as Silver Springs, which showed near-zero change between scenarios.
While most springs showed area decreases under pumping conditions, some months and springs showed increases (Fig. 5), reflecting complex dynamics between adjacent spring systems in regions with relatively flat potentiometric surfaces. Spatially variable pumping alters potentiometric gradients, redistributing contributing areas among springs.
Springshed overlap
For all assessed springs, overall springsheds overlapped to varying degrees with adjacent springs considered in this study; that is, all springsheds included some areas that contributed to adjacent systems during one or more months. Specifically, overlap ranged from 2% to 41% of overall springshed area, depending on spring and scenario, with a median of 32%. However, these overall overlap estimates are likely low since not all regional springs were included in the study.
In particular, high overlap occurred between the Rainbow and Silver springsheds, as noted in earlier work showing that drier conditions (lower rainfall, higher pumping) tend to increase the size of the Rainbow springshed while Silver decreases and vice versa (WSI, 2013). The current study builds upon those findings by providing a quantitative and visual illustration of the back-and-forth relationship between the two springsheds.
Between scenarios, changes in overlap percentage may result from changes in overall springshed area rather than large changes in absolute overlapping area, as seen for Silver Springs (Figs. 4-6).
Management implications
Overall, this study underscores the need for regional-scale management that considers the interconnectedness of adjacent springsheds, as noted in Cohen et al. (2016). Such efforts are ongoing, as seen in the collaborative development of the Central Springs Model by two water management districts and regional assessments completed by the three-district Central Florida Water Initiative (Florida Statutes, 373.0465), and should continue to be supported.
Particularly in overlap areas, management strategies should consider potential impacts to multiple springs, since withdrawals or contaminants could influence more than one system depending on groundwater conditions. Programs such as basin management action plans that spatially target management actions using springsheds should continue to adopt conservative approaches that encompass the maximum potential extent of contributing areas, utilizing buffers (e.g., Freese & Sutherland, 2017, Harris et al., 2017), or specifying travel times (e.g., Munch et al., 2007). Understanding springshed boundary shifts under varying hydrologic conditions can improve identification of spring protection areas.
Limitations
The automated model-based approach used in this study offers some advantages, including efficiency, reproducibility, and the ability to consistently analyze multiple time periods across different spring systems. Specifically, the model provides a spatially and temporally complete dataset necessary for systematic temporal analysis both within and among springs, filling gaps that would otherwise prevent consistent analysis across the 13-year study period.
However, this method also has significant limitations. All springshed delineations from models are inherently constrained by model simplifications, resolution, and error (Shoemaker et al., 2004), and several additional factors further affect the reliability of springshed areas from this study. Calibration for the Central Springs Model focused primarily on matching observed flows and water levels, rather than explicitly validating springshed boundary fluctuations. Uncertainty in the pumps-off scenario limits comparisons between scenarios. Additionally, the automated delineation method is sensitive to outlet snapping and cannot effectively detect spring boundaries along structurally controlled edges or along flat coastal gradients. Outlier removal may have removed some valid delineations, underestimating springshed variability. Finally, while 2006 to 2018 represents long-term average precipitation conditions, wettest years are somewhat underrepresented (FCC, 2025). The results are thus most appropriate for exploring springshed variability over time rather than serving as definitive delineations.
Future research directions
Future work should seek to improve algorithmic methods for springshed delineation, assess additional springs, explore additional scenarios, and implement particle tracking using the recently updated Central Springs Model v1.1 (Sisco et al., 2025). While automated approaches offer efficiency and consistency, professional interpretation remains critical for handling flat coastal gradients and integrating knowledge of physical features and regional hydrogeology. A combined approach that leverages both automated time-series analysis and expert knowledge can provide more robust foundations for spring protection efforts, which will be increasingly important as changing patterns in water use, land use, and climate continue to affect spring systems.
Acknowledgments
The author thanks staff at the St. Johns River Water Management District (SJRWMD) and Southwest Florida Water Management District (SWFWMD) for their collaborative development of the Central Springs Model. The author is also grateful to SWFWMD staff for valuable discussions on springshed variability while employed at the District.
Author Contributions
Cortney R. Cameron: Conceptualization, Data curation, Formal analysis, Investigation, Methodology, Software, Visualization, Writing – original draft, Writing – review & editing.
Data Availability
All data and code are available at https://doi.org/10.5281/zenodo.15483571
Transparent Peer Review
Results from the Transparent Peer Review can be found here.
Recommended Citation
Cameron, C.R. (2025). Modeling groundwater contributing areas to Florida springs: spatiotemporal variability and pumping effects on springshed boundaries. Stacks Journal: 25009. https://doi.org/10.60102/stacks-25009
References
Alexander, Scott C., Andrew J. Luhmann, E. Calvin Alexander, Jr., Jeffrey A. Green, and Andrew J. Peters. 2008. “Spring Characterization Methods and Springshed Mapping.” In Sinkholes and the Engineering and Environmental Impacts of Karst, 485–94. Tallahassee, Florida, United States: American Society of Civil Engineers. https://doi.org/10.1061/41003(327)46.
Barquín, José, and Mike Scarsbrook. 2008. “Management and Conservation Strategies for Coldwater Springs.” Aquatic Conservation: Marine and Freshwater Ecosystems 18 (5): 580–91. https://doi.org/10.1002/aqc.884.
Barry, John D., Anthony C. Runkel, and E. Calvin Alexander. 2023. “Synthesizing Multifaceted Characterization Techniques to Refine a Conceptual Model of Groundwater Sources to Springs in Valley Settings (Minnesota, USA).” Hydrogeology Journal 31 (3): 707–29. https://doi.org/10.1007/s10040-023-02613-w.
Bartel, R.L., K. Barrios, M. Pritzl, and K. Coates. 2011. “Jackson Blue Spring: Water Resources Assessment.” Havana, FL: Northwest Florida Water Management District
Bridger, K., J. Dodson, G. Maddox, and B. Katz. 2017. “Nutrient TMDL for Wacissa River and Springs (WBIDs 3424 and 3424Z) and Documentation in Support of Development of Site-Specific Numeric Interpretations of the Narrative Nutrient Criterion.” Tallahassee, FL: Florida Department of Environmental Protection.
Cameron, C., R. Basso, and M. Kelly. 2020. “Summary Statistics of Rainfall Data for Sites in West-Central Florida.” Southwest Florida Water Management District.
Cantonati, M., R. Gerecke, and E. Bertuzzi. 2006. “Springs of the Alps – Sensitive Ecosystems to Environmental Change: From Biodiversity Assessments to Long-Term Studies.” Hydrobiologia 562 (1): 59–96. https://doi.org/10.1007/s10750-005-1806-9
Cohen, M. 2008. “Springshed Nutrient Loading, Transport and Transformations.” In Summary and Synthesis of the Effects of Nutrient Loading on Spring Ecosystems and Organisms, 53–134. Gainesville, FL: University of Florida Water Institute.
Cohen, M., L. Wilson, and D. Yobbi. 2016. “Peer Review of the Recommended Minimum Flow for the Rainbow River System: Final Panel Review Document, November 21, 2016.” Brooksville, FL: Prepared for the Southwest Florida Water Management District.
Copeland, R.E., and A. Woeber. 2021. “Changes In Groundwater Levels, Spring Discharge, and Concentrations of Saline and Rock-Matrix Indicators of the Floridan Aquifer System, Florida (1991–2011) (FGS Bulletin 70).” Tallahassee, FL: Florida Geological Survey. https://doi.org/10.35256/B70.
Fairfax, R.J., and R.J. Fensham. 2003. “Great Artesian Basin Springs in Southern Queensland 1911-2000.” Memoirs of the Queensland Museum 49 (1): 285–93.
Florida Climate Center [FCC]. 2025. “Precipitation.” https://climatecenter.fsu.edu/products-services/data/statewide-averages/precipitation.
Florida Department of Environmental Protection [FDEP]. 2013. “Variability in Springsheds Delineated by Potentiometric Surfaces: A Discussion Paper to Support the Silver Springs Basin Management Action Planning Process.” Tallahassee, FL: Florida Department of Environmental Protection. https://web.archive.org/web/20170427163955/https://www.silverspringsalliance.org/Resources/Documents/Variability%20in%20Springsheds%20Delineated%20by%20Potentiometric%20Surfaces.pdf.
Florida Department of Environmental Protection [FDEP]. 2022. “Outstanding Florida Springs (OFS) – Springsheds.” https://geodata.dep.state.fl.us/datasets/FDEP::outstanding-florida-springs-ofs-springsheds/about.
Freese, R., and A.B. Sutherland. 2017. “Minimum Flow Determination for Alexander Springs, Lake County, Florida.” Technical Publication SJ2017-3. Palatka, FL: St. Johns River Water Management District.
Gao, Yuan, Zexuan Xu, Shen Li, and Wenjie Yu. 2022. “Modeling Monthly Nitrate Concentration in a Karst Spring with and without Discrete Conduit Flow.” Water 14 (10): 1622. https://doi.org/10.3390/w14101622.
Ghosh, Debapi K., Dingbao Wang, Matthew V. Bilskie, and Scott C. Hagen. 2016. “Quantifying Changes of Effective Springshed Area and Net Recharge through Recession Analysis of Spring Flow.” Hydrological Processes 30 (26): 5053–62. https://doi.org/10.1002/hyp.10970.
GRASS Development Team, Martin Landa, Markus Neteler, Markus Metz, Anna Petrášová, Vaclav Petráš, Glynn Clements, et al. 2025. GRASS GIS. https://doi.org/10.5281/ZENODO.5176030.
Green, J.A., J.D. Barry, and E.C. Alexander. 2014. “Springshed Assessment Methods for Paleozoic Bedrock Springs of Southeastern Minnesota.” Minnesota Department of Natural Resources. http://dx.doi.org/10.13140/RG.2.1.4729.5604.
Harris, C., N. Mouzon, F. Gordu, and A.B. Sutherland. 2017. “Determination of Minimum Flows for Silver Glen Springs, Marion and Lake Counties, Florida.” Technical Publication SJ2017-4. Palatka, FL: St. Johns River Water Management District.
Hunter, Malcolm L., Vicenç Acuña, Dana Marie Bauer, Kathleen P. Bell, Aram J.K. Calhoun, María R. Felipe-Lucia, James A. Fitzsimons, et al. 2017. “Conserving Small Natural Features with Large Ecological Roles: A Synthetic Overview.” Biological Conservation 211:88–95. https://doi.org/10.1016/j.biocon.2016.12.020.
Kincaid, Todd R, and Brent A Meyer. 2013. “Delineation of Springshed Boundaries for Silver Springs Florida and Surrounding Major Springs.” GeoHydros, LLC. http://rgdoi.net/10.13140/RG.2.2.17155.76329.
Kincaid, T.R., G.J. Davies, C. Werner, and R.S. DeHan. 2012. “Demonstrating Interconnection between a Wastewater Application Facility and a First Magnitude Spring in a Karstic Watershed: Tracer Study of the Southeast Farm Wastewater Reuse Facility, Tallahassee, Florida.” Report of Investigation No. 111. Tallahassee, FL: Florida Geological Survey. https://doi.org/10.35256/RI111.
Kincaid, T.R., B.A. Meyer, and K.E. Day. 2014. “Assessment of the 2008 North Florida Numerical Groundwater Flow Model: Limitations & Implications for Groundwater Resource Management.” GeoHydros, LLC.
Knowles, L., A.M. O’Reilly, and J.C. Adamski. 2002. “Hydrogeology and Simulated Effects of Groundwater Withdrawals from the Floridan Aquifer System in Lake County and in the Ocala National Forest and Vicinity, North-Central Florida.” Water-Resources Investigations Report 2002-4207. U.S. Geological Survey.
Laist, David W., Cynthia Taylor, and John E. Reynolds. 2013. “Winter Habitat Preferences for Florida Manatees and Vulnerability to Cold.” PLoS ONE 8 (3): e58978. https://doi.org/10.1371/journal.pone.0058978.
Leeper, D.A., M.S. Flannery, M.G. Heyl, and R. Basso. 2012. “Recommended Minimum Flows for the Homosassa River System.” Brooksville, FL: Southwest Florida Water Management District.
Marella, R. 2020. “Water Withdrawals, Uses, and Trends in Florida, 2015.” Scientific Investigations Report 2019–5147. U.S. Geological Survey.
Munch, D.A., D.J. Toth, C. Huang, J.B. Davis, C.M. Fortich, E.J. Osburn, E.J. Phlips, et al. 2007. “Fifty-Year Retrospective Study of the Ecology of Silver Springs, Florida. Special Publication SJ2007-SP4.” Palatka, FL: St. Johns River Water Management District.
Phelps, G.G. 2004. “Chemistry of Ground Water in the Silver Springs Basin, Florida, with an Emphasis on Nitrate.” Scientific Investigations Report 2004-5144. U.S. Geological Survey. https://doi.org/10.3133/sir20045144.
QGIS Development Team. 2023. “QGIS Geographic Information System.” Open Source Geospatial Foundation Project. https://www.qgis.org.
R Core Team. 2024. “R: A Language and Environment for Statistical Computing.” Vienna, Austria: R Foundation for Statistical Computing. https://www.R-project.org.
Rouse Holzwart, K., Y. Ghile, R. Basso, D. Leeper, and S. King. 2017. “Recommended Minimum Flow for the Rainbow River System.” Brooksville, FL: Southwest Florida Water Management District.
Scott, T.M., G.H. Means, R.P. Meegan, S.B. Upchurch, R.E. Copeland, J. Jones, T. Roberts, and A. Willet. 2004. “Springs of Florida.” FGS Bulletin 66 Tallahassee, FL: Florida Geological Survey. https://doi.org/10.35256/B66.
Shoemaker, W.B., A.M. O’Reilly, N. Sepúlveda, S.A. Williams, L.H. Motz, and Q. Sun. 2004. “Comparison of Estimated Areas Contributing Recharge to Selected Springs in North-Central Florida by Using Multiple Ground-Water Flow Models.” Open-File Report 03-3448. U.S. Geological Survey. https://doi.org/10.3133/ofr03448.
Sisco, L., W. Jin, Q. Sun, J. Kokjohn, and H. Zhang. 2025. “Central Springs Groundwater Flow Model (CSM) Version 1.1 Model Report.” St. Johns River Water Management District and Southwest Florida Water Management District.
Smith, Brian, Brian Hunt, Marcus Gary, Douglas Wierman, and Jeff Watson. 2020. “Springshed Delineation in a Karst Aquifer in Hays County, Central Texas.” Sinkhole Conference 2020, May. https://digitalcommons.usf.edu/sinkhole_2020/ProceedingswithProgram/Hydrology/10.
Southwest Florida Water Management District [SWFWMD]. 2020. “2020 Regional Water Supply Plan: Northern Planning Region.” Brooksville, FL: Southwest Florida Water Management District.
St. Johns Water Management District [SJRWMD]. 2022. “Central Springs/East Coast Regional Water Supply Plan (2020–2040).” Palatka, FL: St. Johns Water Management District.
Stevens, Lawrence E., Edward R. Schenk, and Abraham E. Springer. 2021. “Springs Ecosystem Classification.” Ecological Applications 31 (1): e2218. https://doi.org/10.1002/eap.2218
Sun, Q., W. Jin, N. Ahmed, F Gordu, J. Kokjohn, H. Zhang, and C. Joseph. 2024. “Central Springs Groundwater Flow Model (CSM) Version 1.0.” St. Johns River Water Management District and Southwest Florida Water Management District.
Sutherland, A., R. Freese, J.B. Slater, F. Gordu, J. Di, and G.B. Hall. 2017. “Minimum Flows Determination for Silver Springs, Marion County, Florida.” Technical Publication SJ2017-2. Palatka, FL: St. Johns River Water Management District.
Sutherland, A.B., F. Gordu, J.W. Mace, and A. Karama. 2024. “Minimum Flows and Levels (MFLs) Reevaluation for the Wekiva River at State Road 46, Wekiwa Springs, Rock Springs, Palm Springs, Sanlando Springs, Starbuck Springs, and Miami Springs; and MFLs Determination for the Little Wekiva River, Lake, Orange, and Seminole Counties (DRAFT).” Palatka, FL: St. Johns River Water Management District.
Tukey, J.W. 1977. “Exploratory Data Analysis.” Reading, MA: Addison-Wesley.
Upchurch, S., and K.M. Champion. 2004. “Delineation of Spring Protection Areas at Five, First-Magnitude Springs in North-Central Florida.” Tampa, FL: SDII Global Corporation.
Walsh, S.J., L. Knowles, B.G. Katz, and D.G. Strom. 2009. “Hydrology, Water Quality, and Aquatic Communities of Selected Springs in the St. Johns River Water Management District, Florida.” Scientific Investigations Report 2009–5046. U.S. Geological Survey. https://doi.org/10.3133/sir20095046.
Wetland Solutions, Inc. [WSI]. 2013. “Rainbow Springs Restoration Action Plan.” Prepared for Rainbow River Conservation, Inc.
Wilcoxon, Frank. “Individual Comparisons by Ranking Methods.” Biometrics Bulletin 1, no. 6 (1945): 80-83.
Work, Kirsten. 2020. “Not Just an Arid Landscape Problem: Springflow Declines in a Region with High Rainfall.” Limnologica 82:125766. https://doi.org/10.1016/j.limno.2020.125766.
Wynn, Sara, Tatiana Borisova, and Alan Hodges. 2014. “Economic Value of the Services Provided by Florida Springs and Other Water Bodies: A Summary of Existing Studies: FE959/FE959, 11/2014.” EDIS 2014 (9). https://doi.org/10.32473/edis-fe959-2014.
Open Access
Peer-Reviewed
Creative Commons
Submitted: 8 March 2025
Accepted: 20 May 2025
Published: 27 June 2025
This study did not receive any specific funding.
Conflicts of Interest:
The author declares no conflicts of interest.
© 2025 Cameron. Stacks Journal


