

Parts of a whole: isotopic difference between single keratin-based tissues and whole-body tissues of birds and mammals
KD: https://orcid.org/0000-0002-8090-3749
HVZ: https://orcid.org/0000-0003-3366-5116
Abstract
Stable isotope analysis is a frequently used tool in ecology for unraveling dietary dynamics, physiology, and trophic relationships. In studies that use stable isotope values in mixing models to infer diet, a single tissue is commonly assumed to represent the isotopic composition of a source whole organism. In this study, we examine that assumption in keratin-based tissues for consideration in isotopic diet studies of animals that consume prey whole. By comparing carbon (δ13C) and nitrogen (δ15N) stable isotope values in single tissues of mammals and bird sources, this study aims to determine if non-invasive sampling methods in tissues such as hair and feathers accurately represent the overall isotopic composition of four mammalian species (rats, mice, rabbits, guinea pigs) and one avian species (quail). We found that keratin may be a good proxy in some cases, but keratin was not a universally accurate representation of whole-body isotopic values. Keratin-based tissue and the homogenized whole-body samples were significantly different in δ13C values in mammals (mean 𝚫13Ckeratin-whole-body = –1.93 ± 0.37 ‰), and feathers differed significantly from whole-body in δ15N values in birds (mean 𝚫15Nkeratin-whole-body = –0.32 ± 0.11 ‰). We suggest homogenizing diet sources and maintaining the lipid content especially for animals consuming whole prey. We recommend that future studies reconsider the assumption that non-invasively sampled tissues are representative of whole-body isotopic values and urge researchers to explicitly account for the true diet of their study organism.
Keywords: carbon, diet, nitrogen, stable isotope analysis, trophic discrimination
Introduction
Stable isotope analysis is widely used in ecology to reconstruct diet, characterize trophic interactions, and examine physiological patterns. The carbon (δ13C) and nitrogen (δ15N) isotope composition of animal tissues is a result of the assimilated diet and the isotopic fractionation that results from metabolic processes (DeNiro and Epstein 1978; Bastos et al. 2017). These processes allow for a unique method to analyze an animal’s trophic patterns, but it is necessary to understand the isotopic relationships between a consumer and its diet. Values of δ13C remain relatively stable as carbon moves through food webs, allowing inference of primary sources of carbon (Post 2002; Fry 1988). On the other hand, δ15N values can be an indicator of relative trophic position in the local food web due to their tendency to increase with trophic level (Minagawa and Wada 1984). The magnitude of shift between a consumer and its diet is measured as the trophic discrimination factor (TDF), reported as 𝚫13C for carbon and 𝚫15N for nitrogen, defined as 𝚫13Ctissue-diet = δ13Ctissue − δ13Cdiet (likewise for nitrogen) (Bastos et al. 2017).
TDFs that are calculated for animals that eat whole prey in the wild are largely based on studies that subsampled a single tissue (muscle, blood, or hair) from these diet items as a proxy for whole prey (Therrien et al. 2011). For example, the TDF for snowy owls (Bubo scandiacus) was determined using leg muscle tissue from mice of known origin (Therrien et al. 2011), though owls also digest organs and skin that make up a considerable digestible portion of the prey before regurgitating indigestible components (e.g., keratin structures and bone) in a pellet (Duke 1997). Modification of mammalian bones may also occur during digestion within the owl, suggesting part of the bone is also assimilated (Denys, Reed, and Dauphin 2023). In some species of Falconiformes and in other taxa that eat prey whole including many species of snake, bones are completely digested and not found in the pellets or feces (Duke 1997; Savitzky 2002). Thus, understanding the proportion of body tissues digested and their contributions to overall isotopic value of diet is essential to calculating TDFs of consumers. In contrast to laboratory studies that use nutritionally calibrated pellets, which can be easily homogenized to measure TDFs (Mizutani, Fukuda, and Kabaya 1992; Oelbermann and Scheu 2002), this process is more challenging for consumers that eat whole prey. As a result, researchers often rely on subsamples of tissues thought to be representative of the whole-body value instead.
Utilizing the appropriate TDF for an organism is critical to the accuracy of isotopic mixing models for diet reconstruction (Bond and Diamond 2011). Incorrect TDFs can bias estimated proportions of each diet component resulting in conservation and management implications (Bond and Diamond 2011). For example, depending on the TDF that was used, mixing models for critically endangered Balearic shearwaters (Puffinus mauretanicus) varied substantially (between 2%-56%) in their reliance on fishery discards (Navarro et al. 2009). Thus, it is unclear if losing this artificial resource could affect reproductive success of the shearwater. Many researchers suggest moving away from assumed discrimination factors and determining species-specific TDFs to avoid bias in the estimation of wild animal foraging ecology (Bond and Diamond 2011; Phillips 2012; Eggebo, Groß, and Nash 2023).
To recreate a representative diet of a consumer, samples of prey tissue that can be obtained noninvasively (e.g., hair, feathers, feces) offer methodological advantages (Codron et al. 2007, Ando et al. 2020), but it is unknown to what extent they represent the whole animal isotopic composition. Isotopes of carbon and nitrogen are incorporated differently within tissues due to metabolic processes, and different tissues from the same organism may vary in their isotopic values (Tieszen et al, 1983). Tissues with a high lipid content tend to have lower δ13C values than other tissues, as lipids are depleted in 13C (DeNiro and Epstein 1977). On the other hand, δ15N values are influenced by metabolic interconversions of amino acids, protein synthesis, or protein breakdown, and tissues involved in these processes, such as the liver, often have higher δ15N values (Poupin et al. 2011; Yoneyama, Ohta, and Ohtani 1983). In rats, significant differences in δ15N and δ13C values were found between organs of the same individual (Yoneyama, Ohta, and Ohtani 1983). Similar variation has also been observed in laboratory mice (Mus musculus) and domestic rabbits (Oryctolagus cuniculus) (Yoneyama, Ohta, and Ohtani 1983; Hilderbrand et al. 1996).
Whole-body values include tissues such as fat bodies and organs surrounded by fat pads, like the liver and heart, that may not be reflected in the keratin tissue, though this has not been previously investigated. Lipids represent a substantial portion of carbon and energy transfer in food webs, and consumers may use ingested lipids either through direct routing or through de novo synthesis of molecules, such as lipids or nonessential amino acids (Müller-Navarra 2008; Podlesak and McWilliams 2007; Newsome et al. 2010; Arostegui, Schindler, and Holtgrieve 2019). Additionally, many carnivores do not digest the keratin-based hair or feather tissues of prey they consume (Oelbermann and Scheu 2002), so these tissues may not contribute to the assimilated diet. Thus, it remains uncertain if the use of a single tissue from prey is an accurate proxy for whole-body isotope composition for animals that eat prey whole.
In this study, our objectives were to 1) determine if keratin has a consistent isotopic offset from the whole-body, 2) examine the isotopic values of homogenized whole organism with and without outer covering (hair or feathers) in multiple taxa, and 3) examine the C:N ratios as a proxy for lipid content in these tissues. We compared δ13C and δ15N values plus C:N ratios of hair to the homogenized whole-body of four mammalian species (rats [Rattus spp.], mice, rabbits, and guinea pigs [Cavia porcellus]) and feathers to the whole-body of one avian species (quail [Coturnix coturnix]). We also compared the values of whole-body with the keratin covering removed versus whole-body with keratin covering intact for these organisms to determine to what degree the hair or feather tissue influences the absolute values of the whole-body when homogenized.
Methods and Materials
Prey items were obtained from RodentPro (where they were bred and fed a uniform diet) in April 2023 and stored frozen until analysis. We tested five individuals of each small prey group: pup guinea pigs, extra-large mice, large mice, rat pups, and quail and three individuals of larger prey groups: medium rabbits and extra-large rats. Each individual was weighed, then the hair was removed using a Remington Ultimate Precision Detail Trimmer NE3160, and feathers were plucked manually. The individual was reweighed to determine contribution of keratin outer covering to total organism weight. The trimmer was cleaned between individuals using water and 70% isopropyl alcohol. The individual was then homogenized using one of two methods: an OXO Good Grips Meat Tenderizer and VEVOR Hand Operated 304 Stainless Steel Multifunction Manual Meat Mincer, or a meat tenderizer (because pup rats and large mice were too small for the meat grinder). Between individuals, the meat grinder was fully disassembled and each component plus the meat tenderizer were cleaned with soap and water, then sanitized in 95% ethanol. A subsample of hair or feathers was taken from each individual to analyze separately, and the remainder of this material was blended back into remaining homogenized mass with the meat grinder. All samples were dried at 60°C for at least 24 hours, then ground into powder using a mortar and pestle or finely diced with a scalpel blade (feathers and hair).
We had three tissue types for analysis: 1) homogenized mass of whole-body with keratin removed (three replicates per individual), 2) homogenized mass of whole-body with keratin included (three replicates per individual). This tissue type was from the whole organism ground up with almost all the removed hair or feathers added back in and reground (a very small amount [<0.5g] was set aside for tissue type #3); and 3) keratin tissue only (one replicate per individual). Isotopic values from the three replicates of whole-body and whole-body with keratin removed were averaged, and the mean value was used in statistical analysis for each tissue type. No additional replicates of keratin were taken as organisms were held on a stable diet year-round and the keratin sample should be representative of the homogenous nature of this tissue.
Samples weighing between 0.400 and 0.600 mg were placed into 5 x 9 mm tin capsules and analyzed at the Stable Isotope Mass Spec Lab at the University of Florida on one of two instrumentation combinations with differing elemental analyzers. Samples were combusted on N.C. Technologies 8020 Elemental Analyzer or a Costech 4010 Elemental Analyzer interfaced to a Thermo Scientific V Advantage isotope ratio mass spectrometer via a Thermo Scientific ConFlo IV Universal Interface. Sample gas was measured relative to laboratory N2 and CO2 gases. All isotopic compositions are expressed in standard notation relative to Vienna Pee Dee Belemnite (carbon) or AIR (nitrogen). Two reference materials (USGS40 and USGS41a) were used to normalize measured δ13C and δ15N values in a two-point regression and to calibrate accuracy. The standard deviations of bovine liver (n = 6, 0.09 ‰ [δ13C] and 0.08 ‰ [δ15N]) and porcine keratin (n = 6, 0.09 ‰ [δ13C] and 0.38 ‰ [δ15N]) were used to assess sample precision as matrix-matched working standards. Percent carbon and nitrogen values were used to calculate C:N ratios for all samples.
Linear mixed-effects models using the R package lme4 (Bates et al. 2015) were conducted on mammal and bird data independently due to the difference in sample size between taxa. Within each taxonomic group, mixed effects models were conducted for each isotope. Tissue type was included as a fixed effect for both taxa, and species was included as a random effect for mammals only. Post hoc estimated marginal means (EMM) analysis with confidence level of 95% were used to conduct pairwise comparisons among tissues for both δ13C and δ15N values. Results from the contrasts of the estimated means were used as offset estimates (𝚫).
Results
Patterns in isotopic offsets in tissues differed between the two taxa, such that δ13C values predictably differed among the mammal tissue and δ15N values predictably differed among the bird tissues. For carbon, the EMM analysis resulted in two statistically significant (p<0.05) results for δ13C values in the tissues of mammals: between homogenized whole-body and keratin outer covering (𝚫13Ckeratin-whole-body) at –1.93 ‰ (SE = 0.08), and homogenized whole-body with keratin removed and keratin outer covering (𝚫13Ckeratin-whole-body keratin removed) at –1.90 ‰ (SE = 0.08) (Fig. 1a). The other pairwise relationships in mammals were not significant (Table 1).
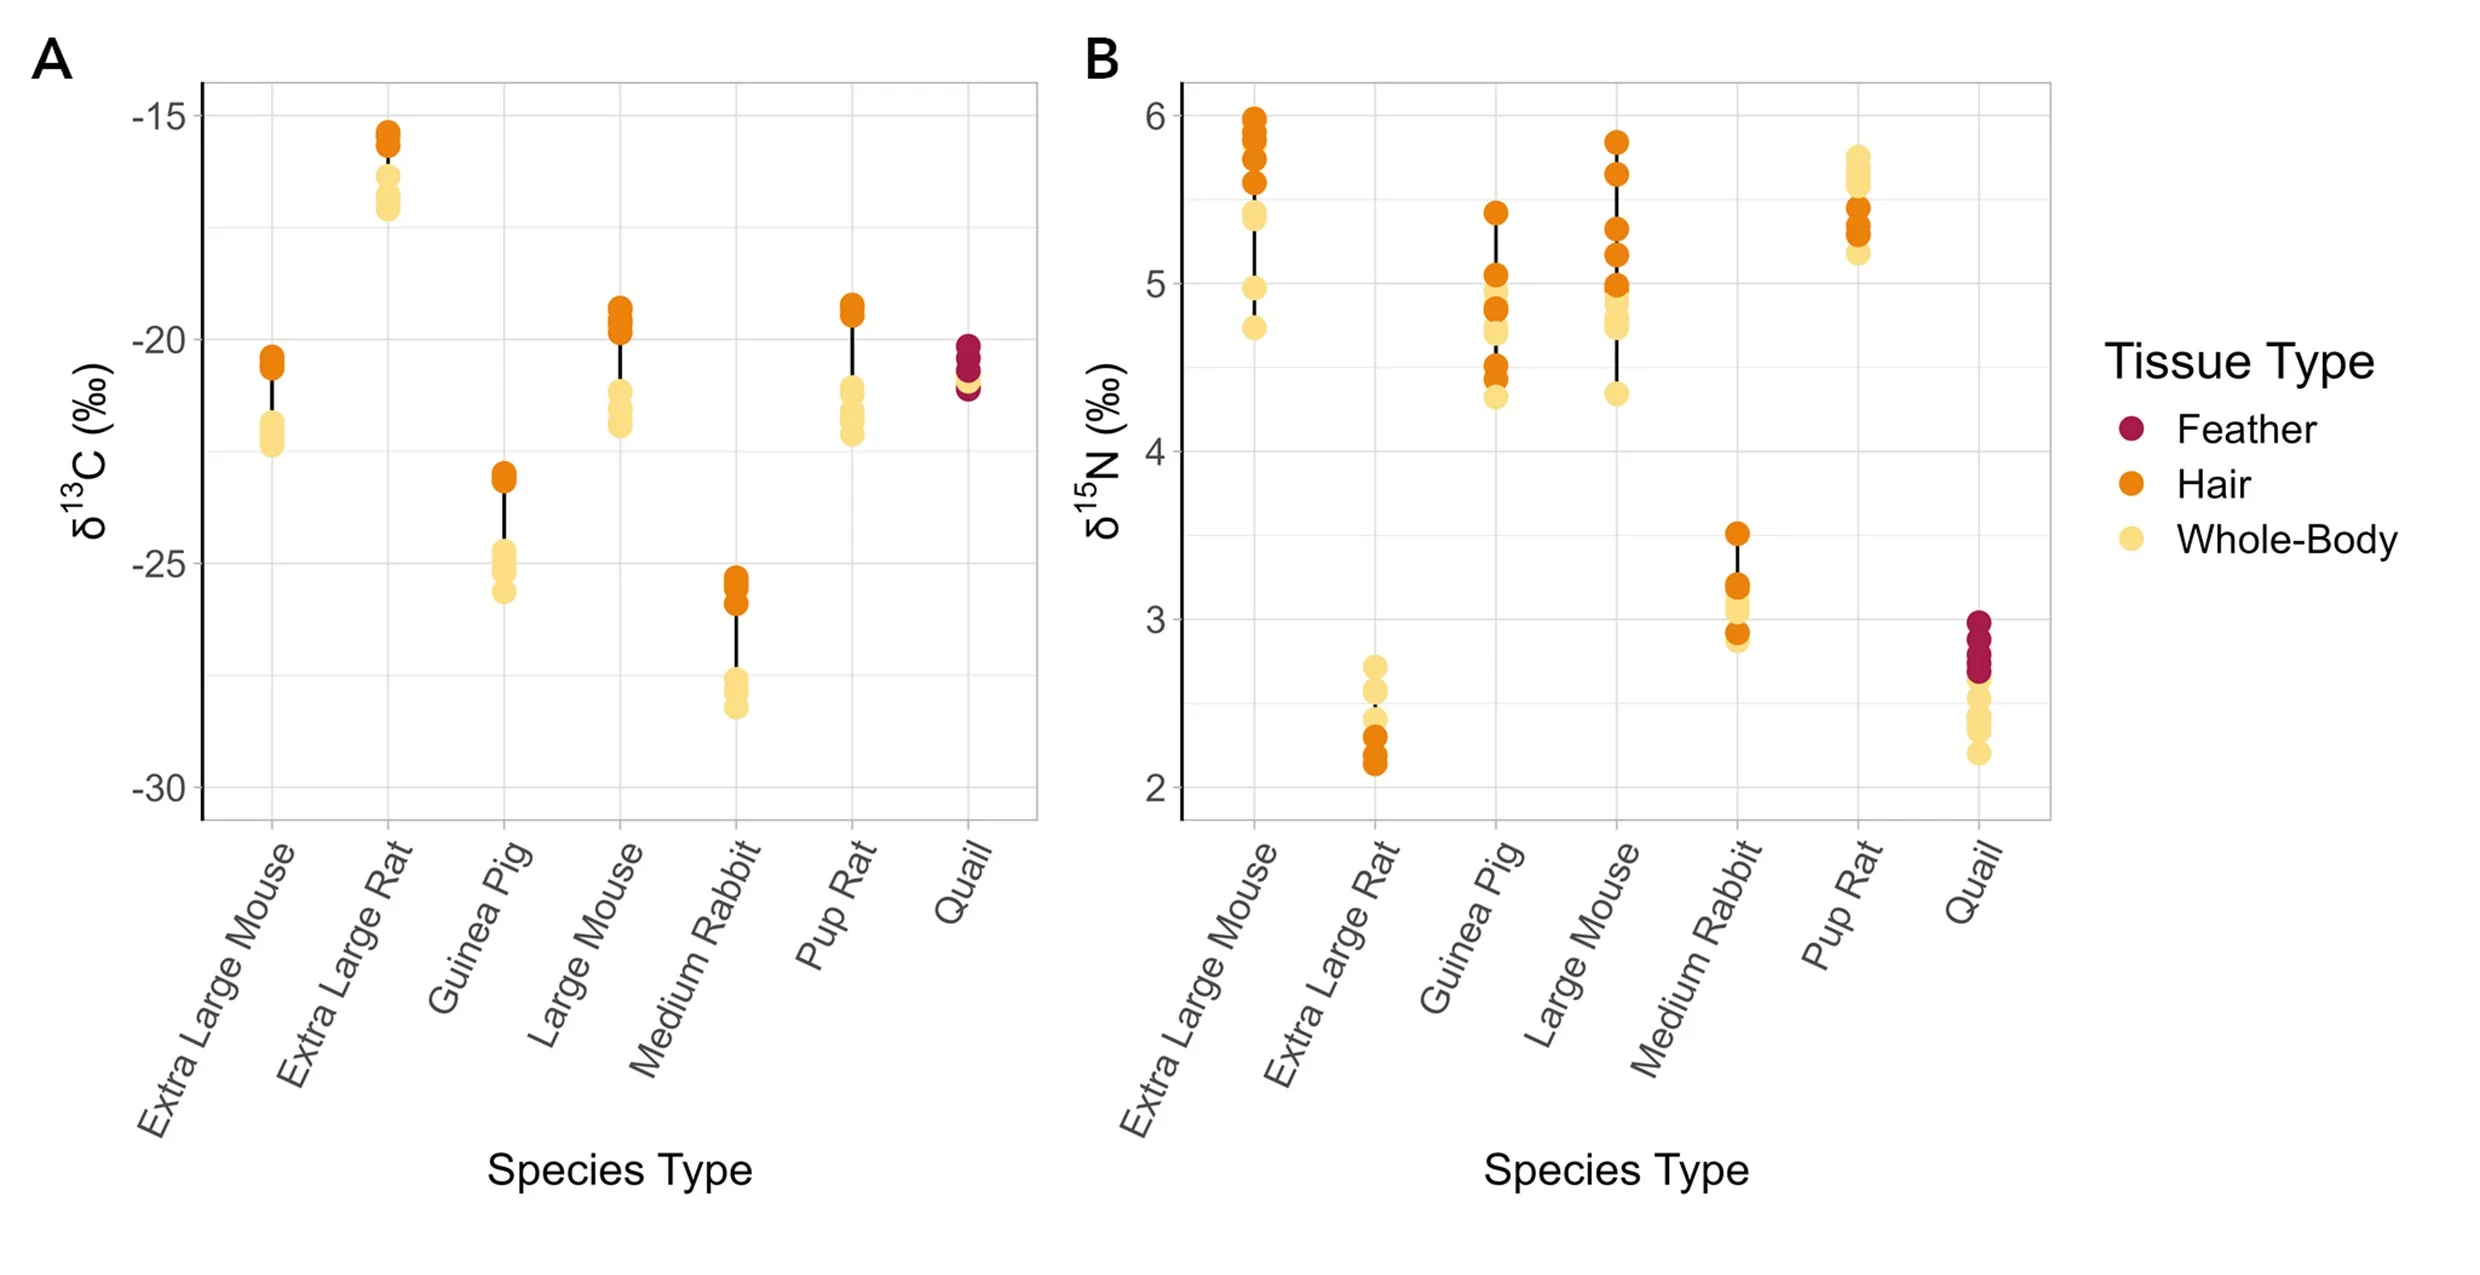
Figure 1. Values of δ13C (A) and δ15N (B) from different tissue types (feather, hair, and whole-body) from five species (mice, rats, guinea pigs, rabbits, and quail). Values of whole-body with keratin removed were not compared in this figure, as they were not significantly different from whole-body.
For nitrogen, the EMM analysis resulted in two statistically significant results for δ15N values in the tissues of birds: between whole-body and keratin (𝚫15Nkeratin-whole-body = –0.32 ‰, SE = 0.05) and between whole-body with keratin removed and keratin (𝚫15Nkeratin-whole-body keratin removed = –0.35 ‰, SE = 0.05) (Fig. 1b). The other pairwise relationships in birds were not significant (Table 1).
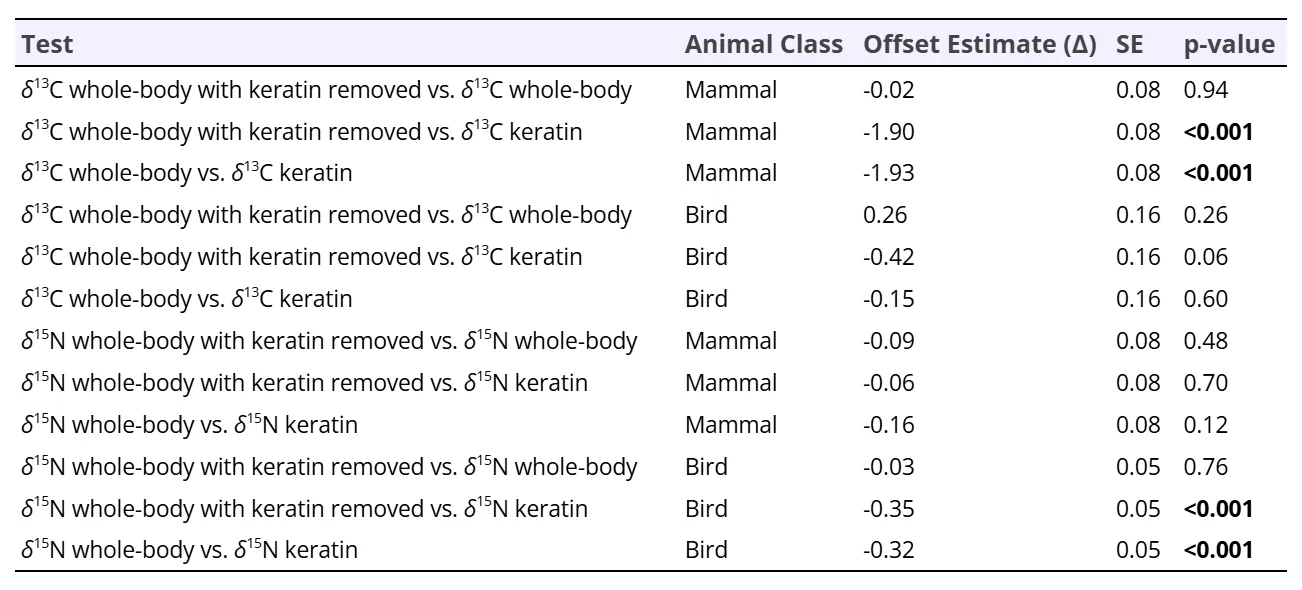
Table 1. Estimated marginal means pairwise comparisons and offsets (contrasts) between tissue δ13C and δ15N values in mammals and birds.
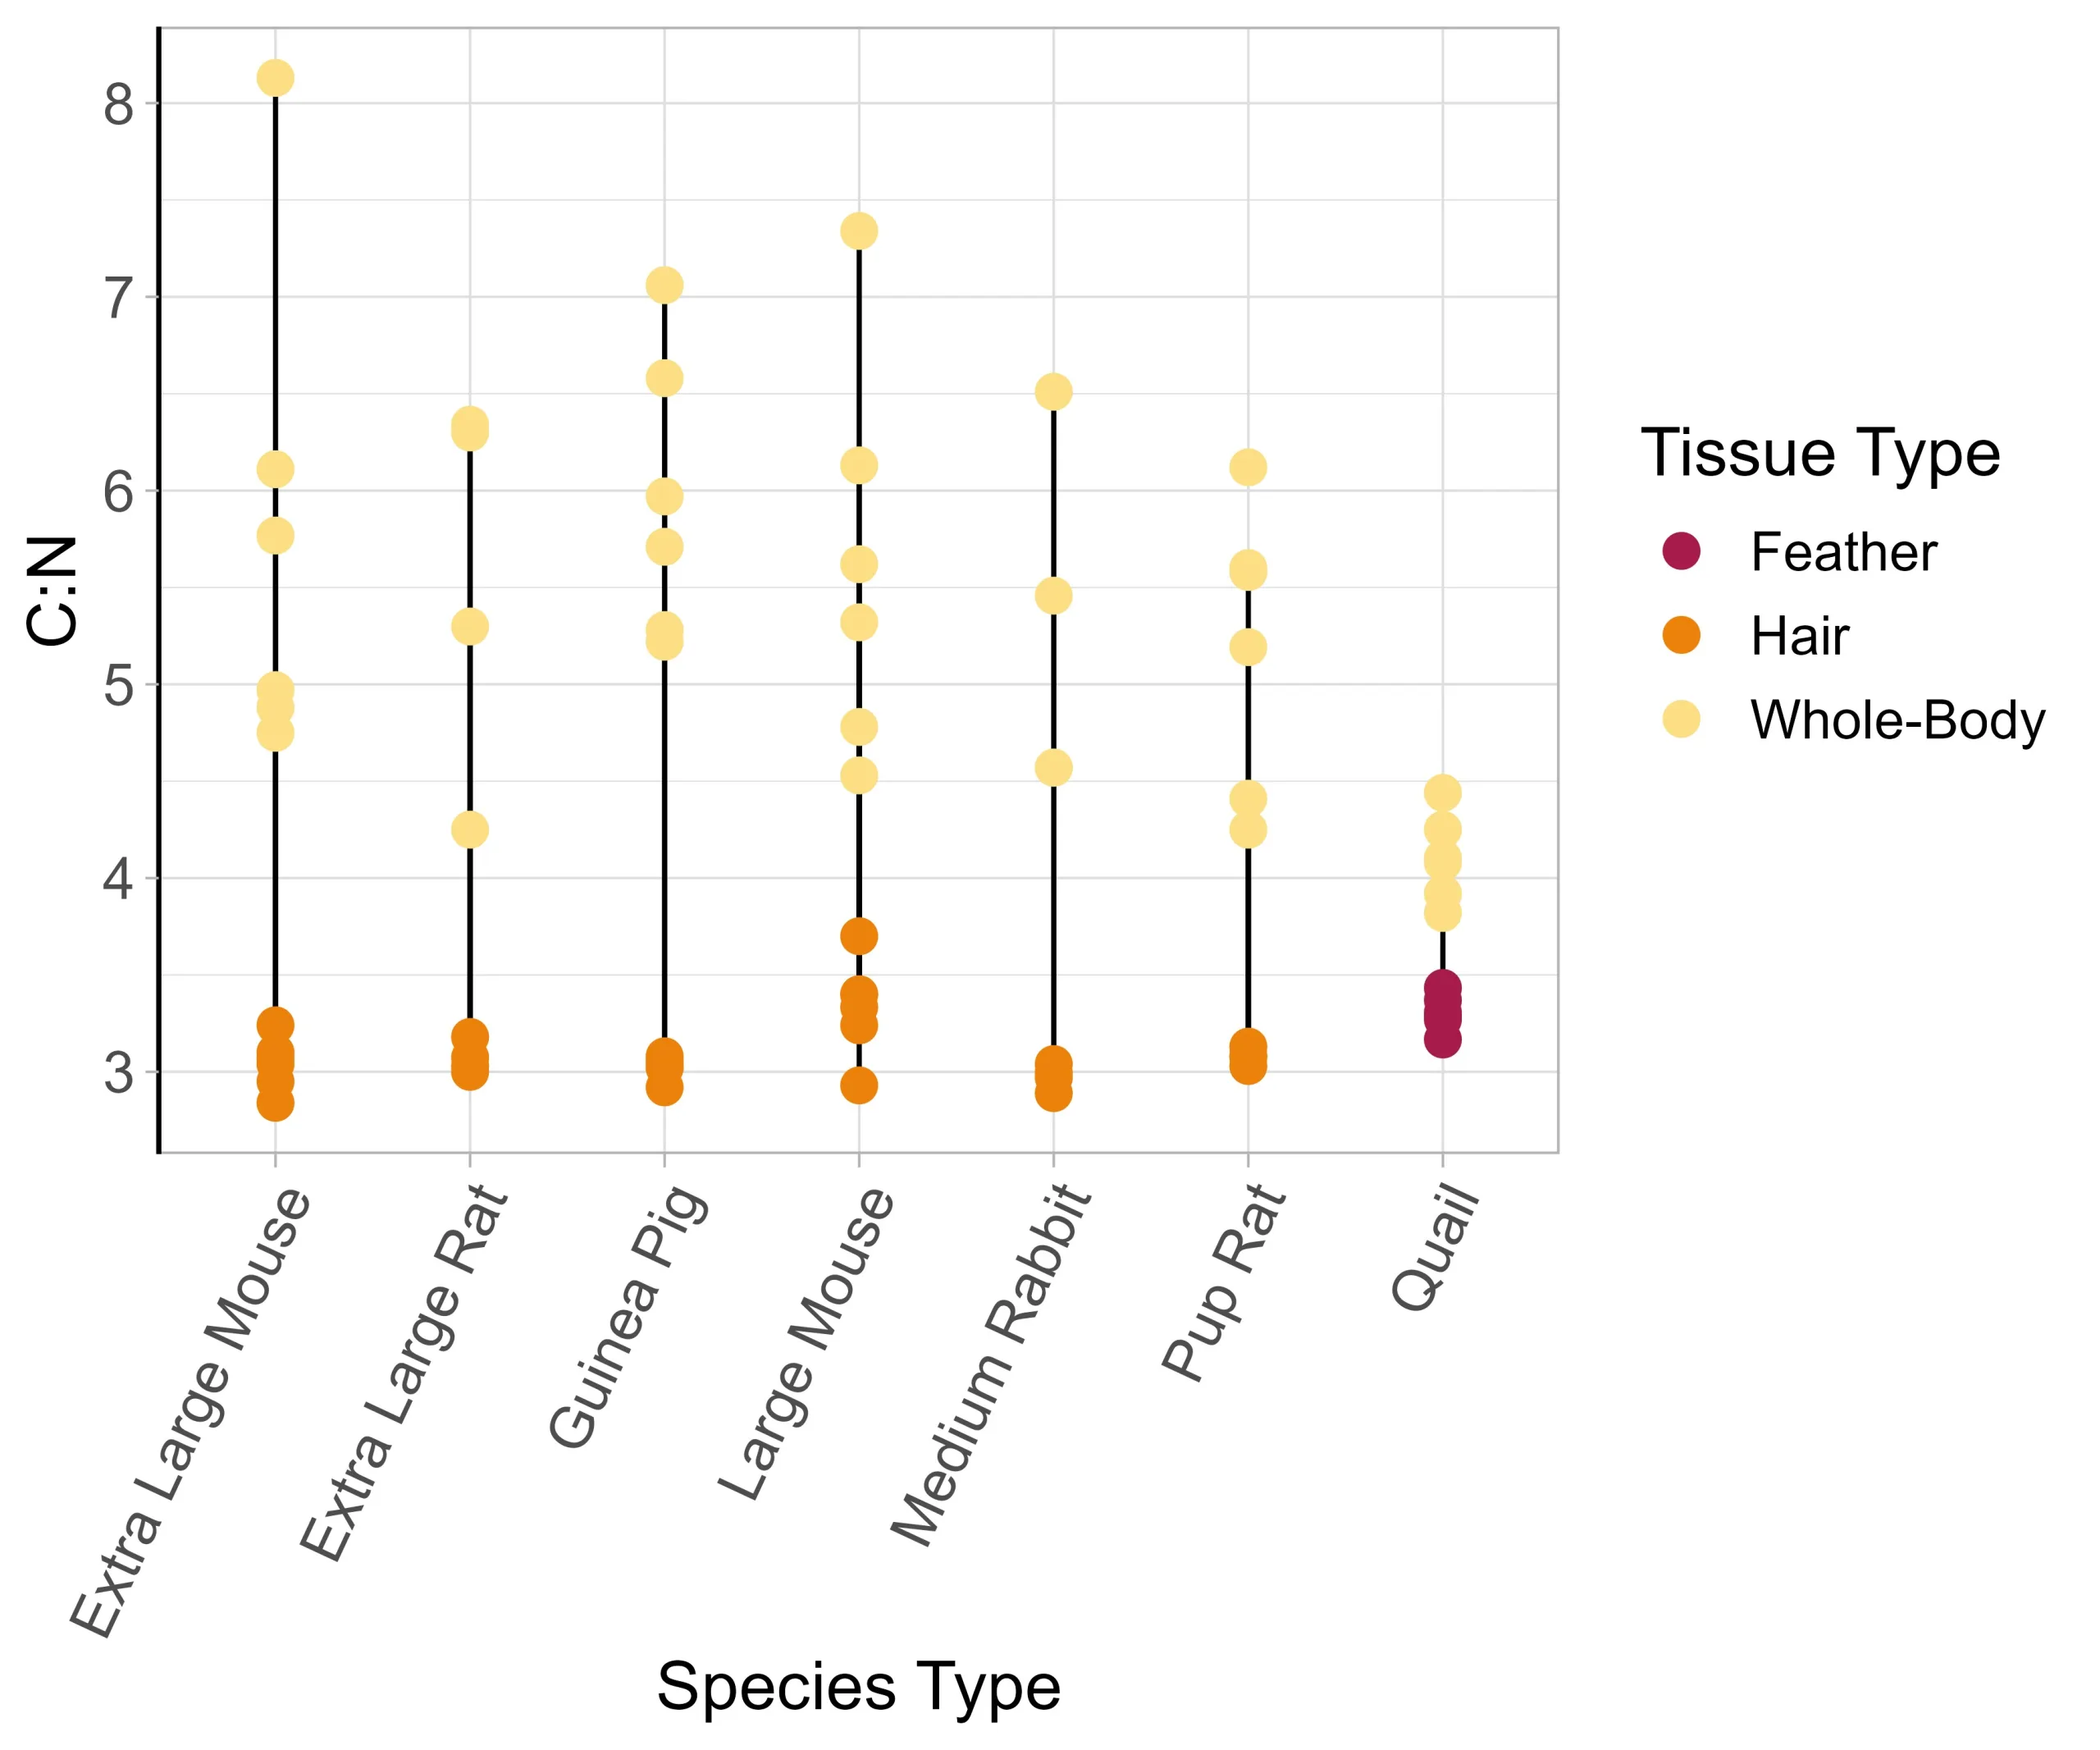
The mass of keratin outer covering was a minimal amount of the total mass of each prey item (reported as mean percent mass for each prey group) extra-large mice (1.04%), extra-large rats (1.07%), guinea pigs (1.76%), large mice (0.88%), rat pups (1.04%), medium rabbits (1.11%), and quail (4.37%). The mean whole-body C:N ratios for each species were: extra-large mice (5.97), extra-large rats (5.64), guinea pigs (5.97), large mice (5.62) medium rabbits (5.21) rat pups (5.19) and quail (4.10) (Fig. 2). The mean difference in C:N ratios across whole-body and keratin outer covering samples was larger in mammals (2.49) than in birds (0.79).
Discussion
By comparing isotopic values from the homogenized whole-body of organisms to their hair or feathers, we found that keratin may be a good proxy in some cases, but keratin was not a universally accurate representation of whole-body isotopic values. Feather δ13C values were representative of whole-body for birds, and hair δ15N values were representative of whole-body for mammals. However, we found that keratin-based tissue and the homogenized whole-body samples were significantly different in δ13C values in mammals and feathers differed significantly from whole-body in δ15N values in birds.
Due to the similarities between whole-body with keratin removed and whole-body isotopic composition, we will focus on the whole-body in this discussion. The observed differences between isotope values of whole-body and keratin outer covering are likely due to distinct metabolic mechanisms affecting variability in δ13C vs. δ15N values (Martínez del Rio et al. 2009). Though we did not directly measure lipid content in this study, the consistently higher C:N ratios in whole-body tissue than hair or feathers are indicative of a higher lipid content (Fig. 2) (Post et al. 2007). One explanation for differences in δ13C values of mammal tissues but not birds could be that mammals have a higher lipid content than birds and higher intra-specific variation (as indicated by the C:N ratios), though we only tested one bird species (quail, Fig. 2). Using the observed C:N values and equation from Post et al. 2007, converting C:N values to percent lipids, the whole-body lipid content of mammals was estimated to be 12–55% and that of birds was 12%. Alternatively, the oil that birds use to preen their feathers, which is high in cholesterol (Elder 1954), may lower the δ13C value of feathers to be more similar to that of whole-body. Avian species with higher fat stores, such as those found in colder climates (Le Maho, 1977) or those that migrate long distances (McWilliams et al. 2004), may not follow this trend. Additional studies of bird species are needed to corroborate feathers as a suitable proxy for whole-body isotope values.
The lower δ13C values in lipids has motivated the common practice to chemically remove or mathematically correct for lipids in diet studies (Sweeting et al. 2006, Post et al. 2007, Hoffman et al. 2015). However, this correction or removal of lipids in prey, consumers, or both, changes their relative positions in isotopic space, which alters the interpretation of mixing model results and may overemphasize the contributions of other macromolecules like protein to the food web (Brett 2014; Mohan et al. 2016) and violate the assumptions of isotopic mass balance used in mixing models (Harvey et al. 2002; Arostegui, Schindler, and Holtgrieve 2019). We opted to maintain the lipids in the measurement of δ13C values in this study, as it is an important macromolecule when considering the diet of animals that consume prey whole. Given the widespread inconsistencies of lipid-treatment in the literature, it has been suggested to compare mixing model results with and without lipid-treatment to determine how ecological interpretations are affected (Arostegui, Schindler, and Holtgrieve 2019).
The nature of keratin as a structural protein may make it more reflective of the whole-body δ15N values, as terrestrial vertebrate dry matter composition is often >50% crude protein (Dierenfeld et al., 2002), and tissues that tend to have the largest differences in δ15N values from hair, such as blood serum and liver (Kurle et al., 2014), proportionally contribute very little to the overall digested body mass in mammals. Though feathers had statistically significantly different δ15N values than whole-body values, the magnitude of this difference (–0.32 ± 0.11 ‰) may be limited in its ecological significance compared to the variability that occurs in δ15N values with trophic position. For example, a standard level of analytical precision for δ15N values is 0.26 ‰ (Jardine and Cunjak, 2005).
Often, tissues are prioritized for sampling when the collection methods are less invasive. In other cases, it may be logistically challenging to fully homogenize whole prey items (Parng, Crumpacker, and Kurle, 2014), and it is not realistic in studies of fossilized remains or in studies of species that are very large, threatened or endangered, or have life histories that make them challenging to capture. Many studies assume that muscle represents the bulk of digestible and assimilated material consumed, an assumption that is often applied to wild carnivores that eat their prey whole and also to carnivores that seek specific tissues. This disparity was noted in a study of the diet of spotted hyena (Crocuta crocuta), in which assuming ingestion of only muscle may have led to an under-representation of more C3-reliant prey in their model due to the exclusion of bone, a 13C-enriched tissue that comprises a noteworthy portion of hyena diets (Codron et al. 2007). The assumption of muscle consumption might be violated by other predators that seek out specific organs. For example, killer whales (Orcinus orca) selectively feed on the livers of broadnose sevengill sharks (Notorynchus cepedianus) (Engelbrecht, Kock, and O’Riain 2019), an organ with higher δ15N values and lower δ13C values than what would be found in a sample of muscle or skin. Polar bears (Ursus maritimus) consume large proportions of blubber in their preferred prey, ringed seals (Pusa hispida) (Stricker et al. 2022), a tissue with a high lipid content and lower δ13C values than fur or muscle. In these cases, quantifying the isotopic values of what is consumed and in what proportions is warranted.
In this study, the non-invasively sampled tissues closely reflected the whole-body δ15N values of mammals, supporting a common assumption that has often been applied without validation. However, we also determined that offsets are needed in some cases (𝚫13Ckeratin-whole-body = –1.93 ± 0.37 ‰ for mammals, 𝚫15Nkeratin-whole-body = –0.32 ± 0.11 ‰ for birds), but this was limited to only a few prey types, so we suggest caution in applying this value more broadly. Given these results, we are unable to make a universal recommendation or suggest a consistent offset to apply, as the results varied among taxonomic groups and isotopes. We suggest that future studies of consumers that eat prey whole more carefully consider the assumption that non-invasively sampled tissues are representative of whole-body isotopic values. If whole-body values are unavailable, or a reliable proxy has not been validated, we suggest caution in interpreting mixing model results, particularly if the ecological outcomes will be applied for management purposes. Isotopic diet reconstructions can reveal trophic dynamics and ecological roles of consumers in the ecosystems they occupy, if accurate TDFs are applied and the corresponding limitations are recognized.
Acknowledgments
The authors would like to thank J. Curtis for his help and expertise running samples for stable isotope analysis and two reviewers for feedback on previous versions of this manuscript.
Author Contributions
Kate R. Davis: Conceptualization (lead); writing – original draft (lead); formal analysis (lead); writing – review and editing (equal).
Hannah B. Vander Zanden: Conceptualization (supporting); resources (lead); review and editing (equal); supervision (lead).
Data Availability
All data are archived in Isobank and can be found here.
Transparent Peer Review
Results from the Transparent Peer Review can be found here.
Recommended Citation
Davis, K. R. & Vander Zanden, H. B. (2025). Parts of a whole: isotopic difference between single keratin-based tissues and whole-body tissues of birds and mammals. Stacks Journal: 25012. https://doi.org/10.60102/stacks-25012
References
Arostegui, M. C., D. E. Schindler, and G. W. Holtgrieve. 2019. Does Lipid-Correction Introduce Biases into Isotopic Mixing Models? Implications for Diet Reconstruction Studies. Oecologia 191: 745–755. https://doi.org/10.1007/s00442-019-04525-7.
Bastos, R. F., F. Corrêa, K. O. Winemiller, and A. M. Garcia. 2017. Are You What You Eat? Effects of Trophic Discrimination Factors on Estimates of Food Assimilation and Trophic Position with a New Estimation Method. Ecological Indicators 75: 234–241. https://doi.org/10.1016/j.ecolind.2016.12.007.
Bates, D., M. Mächler, B. M. Bolker, and S. C. Walker. 2015. Fitting Linear Mixed-Effects Models Using Lme4. Journal of Statistical Software 67: 1–48. https://doi.org/10.18637/jss.v067.i01.
Bond, A. L., and A. W. Diamond. 2011. Recent Bayesian Stable-Isotope Mixing Models Are Highly Sensitive to Variation in Discrimination Factors. Ecological Applications 21: 1017–1023.https://doi.org/10.1890/09-2409.1.
Brett, M. T. 2014. Resource Polygon Geometry Predicts Bayesian Stable Isotope Mixing Model Bias. Marine Ecology Progress Series 514: 1–12. https://doi.org/10.3354/meps11017.
Codron, D., J. Codron, J. A. Lee-Thorp, M. Sponheimer, D. de Ruiter, and J. S. Brink. 2007. Stable Isotope Characterization of Mammalian Predator–Prey Relationships in a South African Savanna. European Journal of Wildlife Research 53: 161–170. https://doi.org/10.1007/s10344-006-0075-x.
DeNiro, M. J., and S. Epstein. 1978. Influence of Diet on the Distribution of Carbon Isotopes in Animals. Geochimica et Cosmochimica Acta 42: 495–506. https://doi.org/10.1016/0016-7037(78)90199-0.
Denys, C., D. Reed, and Y. Dauphin. 2023. Deciphering Alterations of Rodent Bones through in Vitro Digestion: An Avenue to Understand Pre-Diagenetic Agents? Minerals 13: 124. https://doi.org/10.3390/min13010124.
Dierenfeld, E., H. Alcorn, and K. Jacobsen. 2002. Nutrient Composition of Whole Vertebrate Prey (Excluding Fish) Fed in Zoos. National Agricultural Library Z7994.Z65, 20.
Duke, G. E. 1997. Gastrointestinal Physiology and Nutrition in Wild Birds. Proceedings of the Nutrition Society 56: 1049–1056. https://doi.org/10.1079/PNS19970109.
Eggebo, J., J. Groß, and S. Bengtson Nash. 2023. Interpretation of Southern Hemisphere Humpback Whale Diet via Stable Isotopes; Implications of Tissue-Specific Analysis. PLoS One 18: e0283330. https://doi.org/10.1371/journal.pone.0283330.
Elder, W. H. 1954. The Oil Glands of Birds. The Wilson Bulletin 66: 6-31.
Engelbrecht, T. M., A. Kock, and J. O’Riain. 2019. Running Scared: When Predators Become Prey. Ecosphere 10: e02531. https://doi.org/10.1002/ecs2.2531.
Fry, B. 1988. Food Web Structure on Georges Bank from Stable C, N, and S Isotopic Compositions. Limnology and Oceanography 33: 1182–1190. https://doi.org/10.4319/lo.1988.33.5.1182.
Harvey, C. J., P. C. Hanson, T. E. Essington, P. B. Brown, and J. F. Kitchell. 2002. Using Bioenergetics Models to Predict Stable Isotope Ratios in Fishes. Canadian Journal of Fisheries and Aquatic Sciences 59: 115–124. https://doi.org/10.1139/f01-203.
Hilderbrand, G. V., S. D. Farley, C. T. Robbins, T.A. Hanley, K. Titus, and C. Servheen. 1996. Use of Stable Isotopes to Determine Diets of Living and Extinct Bears. Canadian Journal of Zoology 74: 2080–2088. https://doi.org/10.1139/z96-236.
Hoffman, J. C., M. E. Sierszen, and A. M. Cotter. 2015. Fish Tissue Lipid-C:N Relationships for Correcting Values and Estimating Lipid Content in Aquatic Food-Web Studies. Rapid Communications in Mass Spectrometry 29: 2069–2077. https://doi.org/10.1002/rcm.7367.
HJardine, T. D. and R. A. Cunjak. 2005. Analytical Error in Stable Isotope Ecology. Oecologia 144: 528–533. https://doi.org/10.1007/s00442-005-0013-8.
Kurle, C. M., P. L. Koch, B. R. Tershy, and D. A. Croll. 2014. The Effects of Sex, Tissue Type, and Dietary Components on Stable Isotope Discrimination Factors (Δ13C and Δ15N) in Mammalian Omnivores. Isotopes in Environmental and Health Studies 50: 307-321. doi: 10.1080/10256016.2014.908872.
Le Maho, Y. 1977. The Emperor Penguin: A Strategy to Live and Breed in the Cold: Morphology, Physiology, Ecology, and Behavior Distinguish the Polar Emperor Penguin from Other Penguin Species, Particularly from its Close Relative, the King Penguin. American Scientist 65: 680–693.
Martínez del Rio, C., N. Wolf, S. A. Carleton, and L. Z. Gannes. 2009. Isotopic Ecology Ten Years after a Call for More Laboratory Experiments. Biological Reviews 84: 91–111. https://doi.org/10.1111/j.1469-185X.2008.00064.x.
McWilliams, S.t R., C. Guglielmo, B. Pierce, and M. Klaassen. 2004. Flying, Fasting, and Feeding in Birds During Migration: A Nutritional and Physiological Ecology Perspective. Journal of Avian Biology, 35: 377-393. https://doi.org/10.1111/j.0908-8857.2004.03378.x.
Minagawa, M., and E. Wada. 1984. Stepwise Enrichment of 15N along Food Chains: Further Evidence and the Relation between δ15N and Animal Age. Geochimica et Cosmochimica Acta 48: 1135–1140. https://doi.org/10.1016/0016-7037(84)90204-7.
Mizutani, H., M. Fukuda, and Y. Kabaya. 1992. 13C and 15N Enrichment Factors of Feathers of 11 Species of Adult Birds. Ecology 73: 1391–1395. https://doi.org/10.2307/1940684.
Mohan, J. A., S. D. Smith, T. L. Connelly, E. T. Attwood, J. W. McClelland, S. Z. Herzka, and B. D. Walther. 2016. Tissue-Specific Isotope Turnover and Discrimination Factors are Affected by Diet Quality and Lipid Content in an Omnivorous Consumer. Journal of Experimental Marine Biology and Ecology 479: 35–45. https://doi.org/10.1016/j.jembe.2016.03.002.
Müller-Navarra, D. C. 2008. Food Web Paradigms: The Biochemical View on Trophic Interactions. International Review of Hydrobiology 93: 489–505. https://doi.org/10.1002/iroh.200711046.
Navarro, J., M. Louzao, J. Igual, D. Oro, A. D. Huertas, J. Arcos, M. Genovart, K. Hobson, and M. Forero. 2009. Seasonal Changes in the Diet of a Critically Endangered Seabird and the Importance of Trawling Discards. Marine Biology 156: 2571–2578. https://doi.org/10.1007/s00227-009-1281-3.
Newsome, S. D., G. B. Bentall, M. T. Tinker, O. T. Oftedal, K. Ralls, J. A. Estes, and M. Fogel. 2010. Variation in δ13C and δ15N Diet–Vibrissae Trophic Discrimination Factors in a Wild Population of California Sea Otters. Ecological Applications 20: 1744–1752. https://doi.org/10.1890/09-1502.1.
Oelbermann, K., and S. Scheu. 2002. Stable Isotope Enrichment δ15N and δ13C in a Generalist Predator (Pardosa lugubris, Araneae: Lycosidae): Effects of Prey Quality. Oecologia 130: 337–344. https://doi.org/10.1007/s004420100813.
Parng, E., A. Crumpacker, and C. M. Kurle. 2014. Variation in the Stable Carbon and Nitrogen Isotope Discrimination Factors from Diet to Fur in Four Felid Species Held on Different Diets. Journal of Mammalogy 95: 151–159. https://doi.org/10.1644/13-MAMM-A-014.1.
Phillips, D. L. 2012. Converting Isotope Values to Diet Composition: The Use of Mixing Models. Journal of Mammalogy 93: 342–352. https://doi.org/10.1644/11-MAMM-S-158.1.
Podlesak, D. W, and S. R McWilliams. 2007. Metabolic Routing of Dietary Nutrients in Birds: Effects of Dietary Lipid Concentration on δ13C of Depot Fat and Its Ecological Implications. The Auk 124: 916–925. https://doi.org/10.1093/auk/124.3.916.
Post, D. M. 2002. Using Stable Isotopes to Estimate Trophic Position: Models, Methods, and Assumptions. Ecology 83: 703–718. https://doi.org/10.1890/0012-9658(2002)083[0703:USITET]2.0.CO;2.
Post, D. M., C. A. Layman, D. A. Arrington, G. Takimoto, J. Quattrochi, and C. Montaña. 2007. Getting to the Fat of the Matter: Models, Methods and Assumptions for Dealing with Lipids in Stable Isotope Analyses. Oecologia 152: 179–189. https://doi.org/10.1007/s00442-006-0630-x.
Poupin, N., C. Bos, F. Mariotti, J. F. Huneau, D. Tome, and H. Fouillet. 2011. The Nature of the Dietary Protein Impacts the Tissue-to-Diet 15N Discrimination Factors in Laboratory Rats. PLoS One 6: e28046. https://doi.org/10.1371/journal.pone.0028046.
Savitzky, A. H. 2002. Feeding: Form, Function, and Evolution in Tetrapod Vertebrates. Copeia 2002: 1160–1164. https://doi.org/10.1643/0045-8511(2002)002[1160:]2.0.CO;2.
Stricker, C. A., K. D. Rode, B. D. Taras, J. F. Bromaghin, L. Horstmann, and L. Quakenbush. 2022. Summer/Fall Diet and Macronutrient Assimilation in an Arctic Predator. Oecologia 198: 917–931. https://doi.org/10.1007/s00442-022-05155-2.
Sweeting, C. J., N. V. C. Polunin, and S. Jennings. 2006. Effects of Chemical Lipid Extraction and Arithmetic Lipid Correction on Stable Isotope Ratios of Fish Tissues. Rapid Communications in Mass Spectrometry 20: 595–601. https://doi.org/10.1002/rcm.2347.
Therrien, J. F., G. Fitzgerald, G. Gauthier, and J. Bêty. 2011. Diet–Tissue Discrimination Factors of Carbon and Nitrogen Stable Isotopes in Blood of Snowy Owl (Bubo scandiacus). Canadian Journal of Zoology 89: 343–347. https://doi.org/10.1139/z11-008.
Tieszen, L. L., T. W. Boutton, K.G. Tesdahl, and N. A. Slade. 1983. Fractionation and Turnover of Stable Carbon Isotopes in Animal Tissues: Implications for Δ13C Analysis of Diet. Oecologia. 57: 32-37. doi: 10.1007/BF00379558.
Yoneyama, T., Y. Ohta, and T. Ohtani. 1983. Variations of Natural 13C and 15N Abundances in the Rat Tissues and their Correlation. Radioisotopes 32: 330–332.https://doi.org/10.3769/radioisotopes.32.7_330.
Open Access
Peer-Reviewed
Creative Commons
Submitted: 4 September 2024
Accepted: 6 August 2025
Published: 17 October 2025
Funding Information:
This study did not receive any specific funding.
Conflicts of Interest:
The authors declares no conflicts of interest.


