A comparison of stable isotope values in epidermis and blood of nesting leatherback sea turtles in the Northwest Atlantic Ocean
CollaboratorsReviewers can opt-in to be listed as a Collaborator on the manuscript as recognition for their contributions.: 4 reviewers
Abstract
Leatherback sea turtles (Dermochelys coriacea) are highly migratory, which poses significant challenges for conservation efforts. This study explored the application of stable isotopes to better understand habitat use and behaviors of Florida’s nesting leatherbacks. Our main objectives were to (1) determine if the structure of isotope data were consistent with known pre-nesting foraging individuals, (2) monitor changes in δ¹³C and δ¹⁵N isotope values across epidermis and whole blood during the nesting period, and (3) compare isotopic values between tissue types. Distinct isotopic clusters were identified in δ¹³C values, suggesting variation among individuals that may reflect differences in pre-nesting foraging ecology. Whole blood isotope values remained relatively unchanged across the nesting season for sampled individuals, whereas epidermis fluctuated, contrary to expectations of isotopic turnover rates for these tissues. The isotopic composition of epidermis and whole blood was significantly correlated, allowing for tissue-specific conversion equations. We suggest that studies on leatherbacks should consider the variability in different tissues, as we found blood samples had the least variation in isotopic composition across the nesting season. Together, these results provide new insight into leatherback foraging ecology and support the use of stable isotopes as a growing complementary tool for conservation monitoring.
Keywords: Carbon, nitrogen, habitat-use patterns, intra-population variability, Florida USA
Introduction
Migration plays a critical role in the life cycles of many marine species (Putman, 2018). Sea turtles, like other marine megafauna, have extensive migrations that span various environments throughout different stages of their life cycles; as adults, their foraging grounds are often thousands of kilometers away from nesting sites (Bond & James, 2017; Fossette et al., 2010). Additionally, individuals within the same genetically distinct population (regional management unit, Wallace et al. 2014) can have discrete foraging habitats as adults (Rider et al., 2024; Robinson et al., 2016). To date, satellite telemetry has been the primary method used to investigate habitat-use patterns and behavior in sea turtles (Hays & Hawkes, 2018). However, satellite telemetry is costly, and alternative methods such as genetic (Komoroske et al., 2017) and stable isotope analysis (Figgener et al., 2019) offer valuable information on a far greater number of individuals that cannot be obtained from location data alone. In recent years, there has been a marked increase in using stable isotope analysis to better understand ecological behaviors and movement patterns of marine animals (Trueman & St John Glew, 2019).
In marine environments, the stable isotope composition of animal tissues can provide information about the resources used or geographic regions where animals have foraged. Stable isotope analysis of light elements (C, H, N, O, and S) has been used in a range of taxa to investigate habitat-use and migratory paths (Busquets-Vass et al., 2021; Hanson et al., 2022; Hobson, 2019). This approach is possible because isotope ratios at the base of the marine food webs vary spatially in response to environmental and biogeochemical processes (McMahon et al., 2013). The differences in atomic mass of the stable isotopes influence the way isotope ratios change in the environment, body tissues, and metabolic pathways of an animal (Peterson & Fry, 1987). Therefore, the ratio of stable isotopes in the tissue of the animal can be used to indirectly infer the environment used at the time of tissue formation. Most studies sample individuals at their foraging, breeding, or stopover locations because these sites are known and are often more logistically feasible to sample.
For carbon, the isotopic gradient occurs because the carbon isotope (δ¹³C) values of primary producers are closely linked to dissolved inorganic carbon, which varies geographically due to differences in temperature, ocean circulation, CO₂ availability, and phytoplankton productivity. These differences across latitudinal gradients result in predictable spatial variation in δ¹³C values at the base of marine food webs (Magozzi et al., 2017; McMahon et al., 2013). Individuals feeding at the same trophic level exhibit lower δ¹³C values when occupying higher-latitude habitats (McMahon et al., 2013; Takai et al., 2000). Similarly, δ¹³C values of individuals foraging in offshore (oceanic) regions are lower when compared to those in coastal (neritic) habitats, where inputs from terrestrial ecosystems can elevate δ¹³C values (Burton & Koch, 1999).
Variation in nitrogen isotope (δ¹⁵N) values among marine primary producers occurs because of differences in nitrogen cycling, nitrogen fixation and denitrification (see Montoya 2007 for review). In primary producers, nitrogen fixation lowers and denitrification increases δ¹⁵N values of the primary producers in the ocean. Inshore ecosystems often exhibit elevated δ¹⁵N values due to anthropogenic or land-derived nitrogen inputs, whereas oceanic ecosystems relying on nitrogen fixation tend to show lower values (Landrum et al., 2011). Coastal upwelling can further elevate δ¹⁵N values, although offshore transport of upwelled nutrients may blur these patterns (Walker & McCarthy, 2012). These processes have been used to investigate habitat-use patterns in large scale marine species. In blue whales (Balaenoptera musculus) in the Eastern Pacific Ocean, there were differences in δ¹⁵N values based on foraging location (Busquets-Vass et al., 2021). In Pacific leatherbacks, individual foraging grounds were successfully predicted based on relatively high and low δ¹⁵N values (Seminoff et al., 2012).
Leatherback sea turtles (Dermochelys coriacea) are an ideal species for an integrative isotopic study because they have distinct foraging areas, and strong nest site fidelity which allows them to be sampled throughout a nesting season and over multiple years (Caut et al., 2008; Seminoff et al., 2012). In the Northwest Atlantic Ocean (NWA), adult females typically forage in productive temperate and subpolar regions during the non-breeding period before migrating southward to subtropical and tropical nesting beaches, including those in Florida, where nesting generally occurs between March and July (Bond & James, 2017; Eckert et al., 2006). Migration intervals between nesting and foraging grounds are usually two to three years, whereby individuals will spend majority of this time feeding (Caut et al., 2008). Once at their nesting sites, females can produce an average of eight clutches over a period of 100 days during a season (Plot et al., 2013). The NWA nesting population in Florida has shown a steady upward population trajectory at 11% since standardized nest surveys began in 1979, with current estimates of approximately 2,013 nesting individuals (Florida Fish & Wildlife Conservation Commission, 2026; Stewart et al., 2011).
During the nesting season, females are thought to function largely as capital breeders, relying on stored energy reserves accumulated prior to migration and exhibiting reduced or limited foraging activity while nesting (Perrault et al., 2012, 2016). While at foraging grounds, they consume exclusively gelatinous zooplankton, which have isotopic values that reflect local food webs (Seminoff et al., 2012). Individuals can consume up to 840 kg/day in gelatinous zooplankton (Heaslip et al., 2012), which is needed to fuel migration and sustain the largest reproductive output of all reptile species (Perrault et al., 2012; Plot et al., 2013). While local feeding may occur at the nesting grounds, the extent to which this intake contributes to tissue isotope values during the nesting season remains uncertain. If feeding continues through this period, recently assimilated resources may be incorporated into tissues with relatively faster isotopic turnover more strongly than tissues integrating over longer time periods.
Understanding ecological functions of sea turtles using a stable isotope approach requires strategic selection of tissue types. Tissue turnover rates provide temporal information for interpreting the time period over which isotopic signals are integrated into biological tissues (Vander Zanden et al., 2015a). In hard-shelled turtles, epidermis tissue has been frequently used to determine foraging area origin, due to its ease of collection and turnover rate that is estimated to reflect the foraging period (Ceriani et al., 2017; Pajuelo et al., 2012; Seminoff et al., 2012; Vander Zanden et al., 2015b). Previous studies in juvenile green sea turtles (Chelonia mydas) noted differences in turnover rates among various tissues. Skin has the longest residence time (83 days for δ¹³C and 67 days for δ¹⁵N values) compared to red blood cells (RBCs; 79 days for δ¹³C and 71 days for δ¹⁵N values), and whole blood (43 days for δ¹³C and 35 days for δ¹⁵N values) (Reich et al., 2008; Seminoff et al., 2009). Conversely, plasma has the comparatively fastest isotopic turnover at 20 days for δ¹³C and 19 days for δ¹⁵N values (Reich et al., 2008; Seminoff et al., 2007) and may be valuable for capturing short-term dietary changes across the nesting season. Because epidermis and whole blood have relatively long turnover times, their isotopic composition in nesting leatherbacks is expected to primarily reflect resource use prior to arrival at nesting beaches, especially if collected early in an individual’s nesting season.
Although relative turnover rates in leatherbacks are assumed to be comparable to those of hard-shelled species, leatherbacks exhibit unique physiological traits, such as endothermy (Bostrom et al., 2010; Davenport et al., 2015), larger body size, and distinct metabolic rates, which may influence tissue turnover and isotopic incorporation differently (Thomas & Crowther, 2015; Vander Zanden et al., 2015a). Compared to hard-shelled species such as loggerheads (Caretta caretta), leatherbacks generally have longer migrations between nesting and foraging habitats, often traveling to high-latitude pelagic foraging regions in the North Atlantic Ocean (Bond & James, 2017). Although leatherback-specific turnover rates are unmeasured, epidermis is assumed to more strongly retain pre-nesting foraging signals, whereas whole blood and plasma isotopic values might be more likely to reflect any physiological or dietary changes that occur during the nesting season due to their faster turnover times. Observations in isotopic change for leatherbacks during the nesting season have been inconsistent, highlighting uncertainty in assigning precise temporal windows to either tissue (Caut et al., 2008; Fouda et al., 2024; Seminoff et al., 2009). Therefore, improving our understanding of isotopic variability and temporal change across the nesting season in these two commonly collected tissue types could strengthen interpretation of stable isotope data in leatherbacks.
Physiological processes associated with fasting may also influence stable isotope values in nesting leatherbacks. During periods of fasting or nutritional stress, catabolism of endogenous tissues can alter isotopic composition because lighter isotopes are often preferentially metabolized and excreted, potentially enriching tissues in ¹⁵N (Fuller et al., 2005; Hertz et al., 2015). Because of the duration that leatherbacks spend while at their nesting sites, it is possible that δ¹⁵N values of tissues with relatively faster turnover rate could increase as a result of fasting (Lübcker et al., 2020). These physiological effects are important to consider when interpreting stable isotope values in nesting turtles, particularly because most turnover estimates have been derived from hard-shelled species rather than reproductive leatherbacks. This uncertainty can be addressed by sampling multiple tissues with different expected integration periods, repeatedly sampling individuals through the nesting season, and recording the timing between sampling events.
In this study, we analyzed δ¹³C and δ¹⁵N values from epidermis, whole blood, and RBCs to characterize isotopic variation in nesting leatherback sea turtles in Florida, USA. Our goals were to (1) assess variation in δ¹³C and δ¹⁵N values among tissue types and across nesting seasons; (2) identify distinct isotopic groupings among individuals and evaluate whether these patterns were consistent with known pre-nesting foraging individuals; (3) evaluate within-season changes in epidermis and whole-blood isotope values to determine whether tissue isotopic composition remains stable or fluctuates during nesting; (4) examine the isotopic relationship between different tissue types to facilitate cross-study comparisons; (5) assess the variability of lipid content through C:N ratios between epidermis and whole blood to evaluate the potential influence on δ¹³C values. Understanding these dynamics is important for the application of stable isotopes in ecological monitoring, particularly when using these data to infer long-term habitat use.
Methods and Materials
Tissue collection
Samples were collected from nesting leatherbacks on Juno and Jupiter Beaches, Florida, USA from March to July between 2014–2022 (Table 1). Skin and blood sample collection occurred during nesting after ~50% of the clutch was deposited when the individual is least likely to react to sampling (Dutton & Mcdonald, 1994). The tissue collection protocol was approved by the University of Florida Institutional Animal Care and Use Committee (Study #202001985) and Florida Fish and Wildlife Conservation Commission (Marine Turtle Permits #16 and #205).
|
Tissue |
2014 |
2015 |
2016 |
2017 |
2018 |
2019 |
2020 |
2021 |
2022 |
Total |
|
Epidermis |
14 |
8 |
31 (2) |
31 (7) |
85 (29) |
83 (21) |
70 (25) |
69 (28) |
4 |
395 (111) |
|
Whole blood |
11 (1) |
11 |
30 (4) |
23 (3) |
0 |
0 |
0 |
74 (31) |
0 |
149 (44) |
|
Red blood cells |
0 |
0 |
0 |
0 |
0 |
0 |
0 |
0 |
19 |
19 |
|
|
|
|
|
|
|
|
|
|
|
563 |
Skin samples were collected from the hind limb during egg deposition using a sterile 6 mm biopsy punch (Thomson et al., 2012). Before and after skin collection, the site was cleaned with a 70% isopropyl alcohol swab. Skin samples were stored in a cryovial with 70% ethanol at room temperature until analysis. Samples were preserved in ethanol because this method has previously been shown to have minimal effects on the stable isotope values of sea turtle epidermis (Barrow et al., 2008).
To collect blood, the venipuncture site was cleaned with a 70% isopropyl alcohol swab before insertion of the needle. Approximately 1 mL of blood was collected from the femoral rete system aseptically using a 20-gauge x 1.5” Monoject (Sherwood Medical, St. Louis, MO, USA) venous collection needle fitted into a BD Vacutainer tube holder (Perrault et al., 2012). Red blood cells were isolated by centrifuging whole blood using a Hettich Rotofix 32A Centrifuge (Tuttlingen, Germany) at 4000 g (5000 RPM) for five minutes prior to freezing in an ultralow freezer until analyses.
Stable isotope analysis
Stable isotope analysis for carbon and nitrogen was conducted at the Light Stable Isotope Mass Spec Lab in the Department of Geological Sciences at the University of Florida. Skin samples were processed by first removing the epidermis from the dermis using a scalpel, subsequently rinsing the samples with distilled water, and then cutting each sample into 10–20 smaller pieces. and drying for 24–48 h at 60°C (Vander Zanden et al., 2014). Blood samples were processed by drying for 24–48 h at 60°C; once dried samples homogenized with a ceramic pestle (Reich et al., 2008).
From each tissue type, a mass ranging from 0.45 to 0.55 mg was weighed into tin capsules. Two instruments were used for measuring elemental compositions (% C and % N) and stable isotope values. For samples collected from 2014–2019, a COSTECH ECS 4010 elemental analyzer interfaced via a Finnigan™-MAT ConFlow III device to a Finnigan™-MAT DeltaPlus XL isotope ratio mass spectrometer was used. Samples from 2020–2022 were measured using Thermo IsoLink elemental analyzer interfaced via a ConFlo IV to a Thermo Delta V Advantage isotope ratio mass spectrometer.
Results are expressed in delta notation using a per mil scale with the standard equation (Coplen, 2011):
\delta X = \left( \frac{R_{\text{sample}}}{R_{\text{standard}}} – 1 \right)
Where X is 13C or 15N, and Rsample and Rstandard are the ratios of heavy to light isotope (13C/12C and 15N/14N) of the element in the sample and standard, respectively. All results are referenced to Vienna Pee Dee Belemnite for carbon isotope values, and to air for nitrogen isotope values. The reference materials USGS40 (L-glutamic acid with isotopic compositions of δ13C = –26.24 ‰ and δ15N = –4.52 ‰), USGS41 (L-glutamic acid with isotopic compositions of δ13C = 37.76 ‰ and δ15N = 47.57 ‰), and USGS41a (L-glutamic acid with isotopic compositions of δ13C = 36.55 ‰ and δ15N = 47.55 ‰) were used in a linear normalization of results. To examine analytical precision with a matrix-matched working standard, homogenized loggerhead (Caretta caretta) scute keratin was used. The standard deviation of the scute reference material was 0.13 ‰ for δ13C values and 0.09 ‰ for δ15N values (n = 14).
Statistical analysis
All statistical analyses were conducted in R version 4.3.3 (R Core Team, 2024). Results with p-values < 0.05 were considered statistically significant. To evaluate potential differences among epidermis, whole blood, and RBCs, we performed a multivariate permutational analysis of variance (PERMANOVA; Anderson & Walsh, 2013) using both δ¹³C and δ¹⁵N values simultaneously. Analyses were conducted using the vegan package (Oksanen et al., 2024) with Euclidean distance matrices and 999 permutations.
To examine if δ¹³C and δ¹⁵N values changed across nesting seasons, PERMANOVA was conducted independently for each tissue type (epidermis and whole blood) with only the first observation used for an individual in a given year. Red blood cells were not used in this analysis because this tissue was only collected in one nesting season (2022). Individual identity was incorporated into the permutation structure to account for repeated measures, with permutations constrained by individual ID. Homogeneity of multivariate dispersion among years was assessed using the betadisper function in the vegan package (Oksanen et al., 2026), followed by a permutation test of dispersion. Pairwise comparisons among nesting years were conducted in the pairwiseAdonis package (Arbizu, 2017), with permutations similarly constrained by individual ID. Analyses used Euclidean distance matrices and 999 permutations, and p-values from pairwise comparisons were adjusted for multiple testing using the false discovery rate method. Separate comparisons were conducted for δ¹³C and δ¹⁵N values to test for differences among nesting years within each tissue type.
To assess the clustering patterns of δ¹³C and δ¹⁵N values across different tissue types, a model-based clustering approach was implemented using the mclust package (Scrucca et al., 2023). Gaussian mixture models with one to six clusters were evaluated using Bayesian Information Criterion (BIC) values. For analyses including both δ¹³C and δ¹⁵N values, we selected an EII covariance structure model, which assumes spherical clusters with equal volume and variance among groups. To evaluate potential foraging origins of nesting leatherbacks sampled in Florida, epidermis δ¹³C and δ¹⁵N values from nesting leatherbacks in this study were compared with published data from independently identified foraging regions. Reference values were restricted to epidermis, and foraging regions were based on known capture location, providing an independent association between isotope values and geographic region. We inferred post-nesting habitats for Florida leatherbacks (Aoki et al., 2026) to select potential foraging areas off northern Florida/southern Georgia (Dodge et al., 2011), Massachusetts (Dodge et al., 2011), Nova Scotia (Wallace et al., 2014), and the Gulf of Mexico (Hsu, 2020). Because comparisons were made between the same tissue from the same species, trophic discrimination factors were not applied. As δ¹³C values have been used extensively in marine isotope studies to infer habitat use, we applied the same cluster approach above but with only δ13C values. For δ¹³C-only analyses, we used a model structure that assumed equal variance among clusters in a univariate distribution. To ensure each turtle was represented only once per year, we retained the earliest sample when multiple samples existed within the same year and discarded later dates prior to clustering.
We examined within-season temporal variation in isotopic values by focusing on individuals with multiple tissue samples collected across two sampling events within a season. For each individual, we calculated the change in δ¹³C and δ¹⁵N values (represented as Δδ13C and Δδ15N, respectively) between the first and last sampling events, using epidermis and whole blood when paired data were available. The time between two sampling events ranged from 14 to 62 days. We used a set of linear and linear mixed-effects models with isotopic change values (Δδ¹³C or Δδ¹⁵N) as response variables. Models included combinations of time between sampling events as a continuous fixed effect, sampling year as a fixed effect, with and without individual ID included as a random intercept to account for repeated sampling of individuals across different seasons. Intercept-only models were also included for comparison. Linear models were fitted using the lm function in R, and mixed-effects models were fitted using the lme4 package in R (Bates et al., 2015) with maximum likelihood estimation. Models were compared using Akaike’s Information Criterion corrected for small sample size (AIC꜀), and residual diagnostics were visually inspected to assess model assumptions.
We developed conversion equations for translating isotope values between tissue types to facilitate inter-study comparisons. We applied Model II regression, specifically Reduced Major Axis (RMA) regression, using the lmodel2 package (Legendre, 2024). This method accounts for measurement error in both variables and is appropriate when neither tissue type can be considered strictly independent. Separate RMA regressions were conducted to compare epidermis vs. whole blood for both δ¹³C and δ¹⁵N values using paired samples collected from the same individual on the same sampling date for both first and last nesting events. The resulting regression coefficients were then used to generate tissue conversion equations, enabling prediction of isotopic values in one tissue type based on measurements from another.
Finally, to evaluate whether the variability in lipid content differed between tissue types, we compared the variance in C:N ratios of epidermis and whole blood using Levene’s test for homogeneity of variance. The C:N ratio serves as a proxy for lipid content, with higher and more variable values reflecting greater lipid contributions that can bias stable carbon isotope measurements if unaccounted for (Cloyed et al., 2020; Post et al., 2007). Levene’s test was selected because it is robust to deviations from normality and specifically assesses whether two or more groups exhibit equal variance. An RMA regression (see above) was used to examine the relationship between C:N ratio and δ¹³C values. Applying these tests allowed us to determine whether epidermis and whole blood differed in their inherent variability of lipid content and to evaluate how such differences might influence the robustness and interpretation of isotopic comparisons between tissues.
Results
We collected 563 samples from 225 unique individual nesting leatherbacks on Florida beaches between 2014 and 2022 (Table 1). Among these, 111 individuals were sampled more than once for epidermis and 44 individuals for whole blood, allowing for longitudinal comparisons. No individuals were sampled more than once for RBCs. Isotope values differed significantly by tissue type, with epidermis exhibiting higher δ¹³C and δ¹⁵N values than both whole blood and RBCs (PERMANOVA; F₂, 562 = 163.63, r² = 0.37, p < 0.001; Table 2, Fig. 1A). Temporal differences in isotope values remained significant after accounting for repeated sampling of individuals across years. In terms of temporal variation in isotope values, we observed significant differences among years for both epidermis (PERMANOVA; F8,394 = 4.76, r² = 0.12, p < 0.001) and whole blood (PERMANOVA; F4,148 = 12.40, r² = 0.31, p < 0.05). Year explained a greater proportion of variation in whole blood isotope values than in epidermis isotope values. Significant pairwise differences among years were detected for δ¹³C and δ¹⁵N values in epidermis and whole blood (p < 0.05, Fig. 1B,C). In epidermis, δ¹³C values declined in 2016–2017, while δ¹⁵N values were generally higher in 2017–2021 compared to the earliest sampling years (Fig. 1B,C). In whole blood, δ¹³C differences across years were limited, whereas δ¹⁵N values peaked in 2018 and 2021
| Type | n | δ13C mean (SD) | δ15N mean (SD) |
|---|---|---|---|
| Epidermis a | 395 | –17.51 ‰ ± 0.84 | 13.17 ‰ ± 1.31 |
| Red blood cells b | 19 | –18.91 ‰ ± 0.39 | 11.24 ‰ ± 1.24 |
| Whole blood b |
149 | –19.30 ‰ ± 0.57 | 11.35 ‰ ± 1.33 |
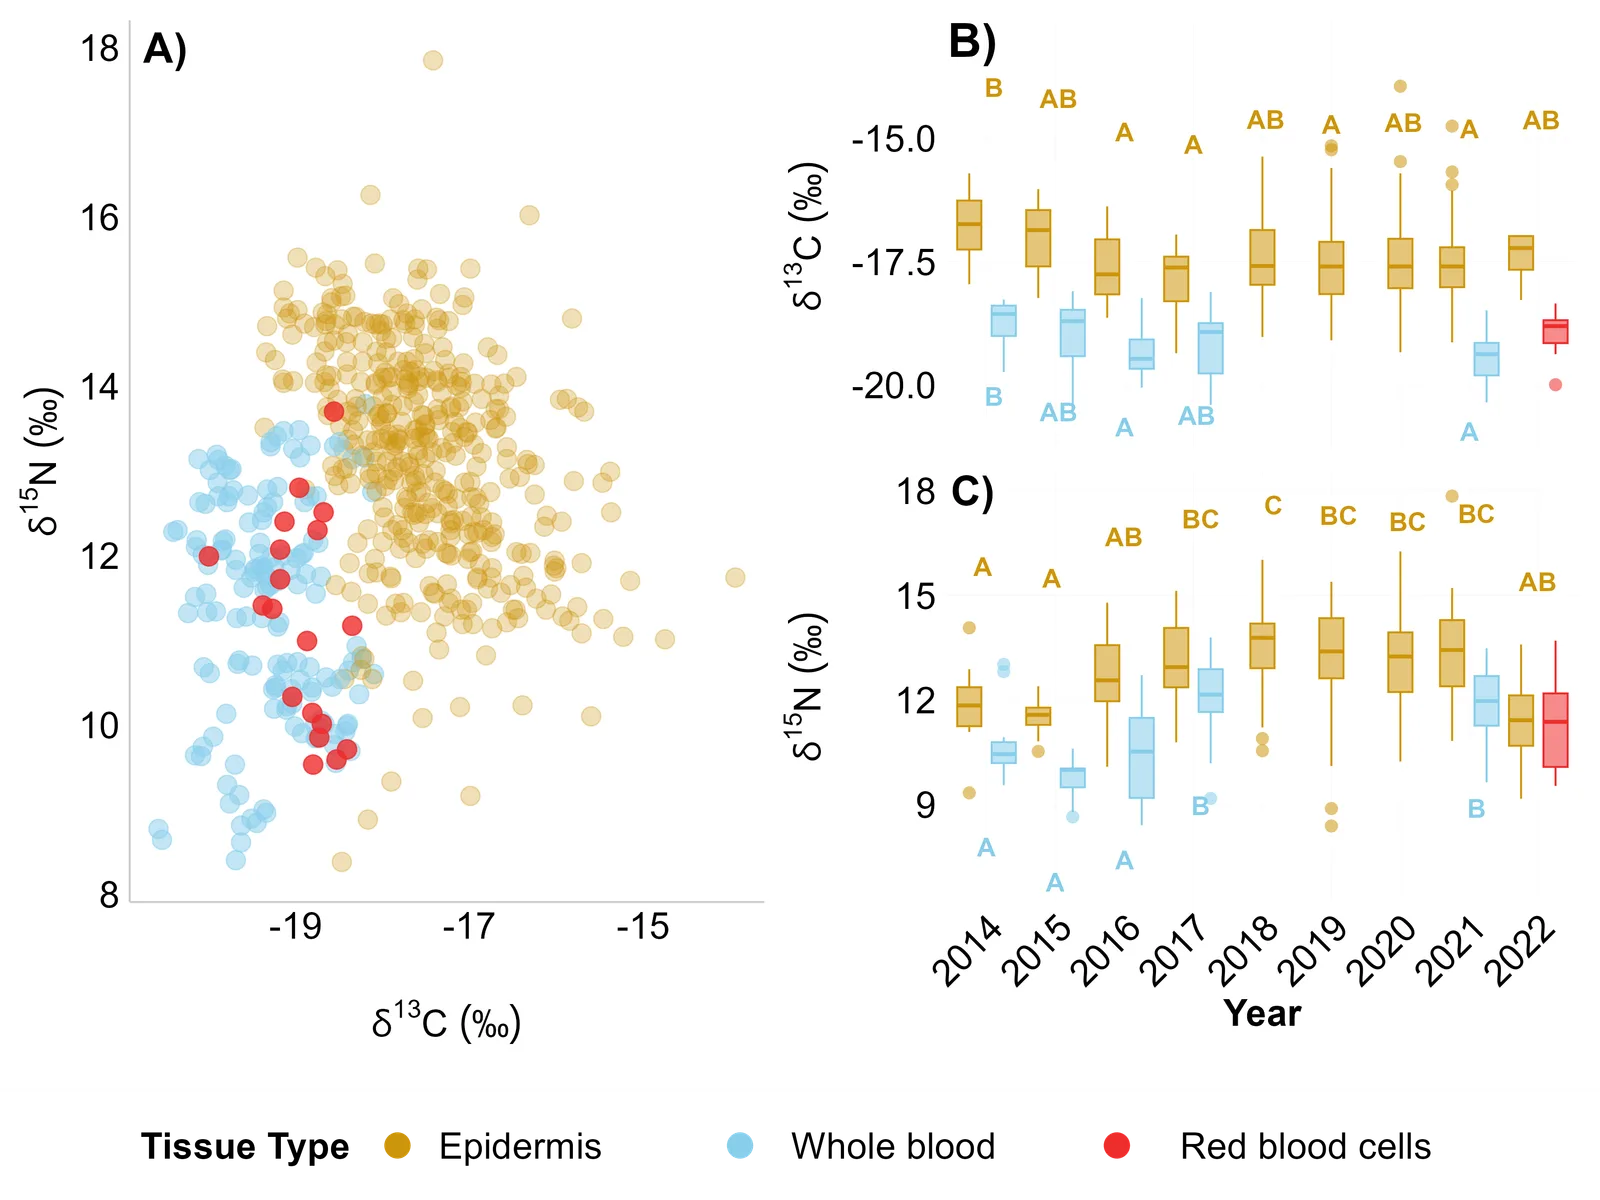
Figure 1. Stable isotope δ¹³C and δ¹⁵N) values from three tissue types (epidermis, whole blood, and red blood cells) collected from nesting leatherback sea turtles (Dermochelys coriacea) at Juno and Jupiter Beaches, Florida, USA. (A) Values of δ¹³C and δ¹⁵N by tissue type. (B) Yearly boxplots of δ¹³C values. (C) Yearly boxplots of δ¹⁵N values. For the boxplots, the horizontal line denotes the median, boxes span the interquartile range (25th–75th percentiles), whiskers extend to 1.5 × the interquartile range, and points beyond whiskers represent outliers. Letters above boxplots denote post hoc pairwise comparisons among years for epidermis and whole blood separately. Groups sharing at least one letter were not significantly different (p > 0.05), whereas groups with no shared letters were significantly different (p < 0.05).
Model-based clustering of epidermis δ¹³C and δ¹⁵N values supported a two-cluster EII model (BIC = −1642, Fig. 2A), which received greater support than the three-cluster (ΔBIC = 12) or no cluster (ΔBIC > 12). Additional cluster models received substantially lower support (ΔBIC > 12). Individuals in the lower δ¹³C value cluster also exhibited reduced δ¹⁵N variability. We also performed clustering using only δ¹³C values, which revealed three clusters (Fig. 2B) compared to two clusters (ΔBIC = 6). Additional cluster models received substantially lower support (ΔBIC > 9). When compared with isotopic values from previous studies, these clusters partially overlapped with isotopic values of leatherbacks from known foraging grounds of Northwest Atlantic (NWA) leatherbacks, including Canada, the South Atlantic Bight, Massachusetts, and the Gulf of Mexico (Fig. 2B). Leatherbacks in our study had epidermis δ¹⁵N values that were generally higher than previously reported for NWA leatherbacks.
Across the nesting season, changes in isotope values were generally small, with limited evidence of consistent directional trends (Fig. 3). Changes in stable isotope (Δδ¹³C and Δδ¹⁵N) values across sampling intervals differed between tissue types. In epidermis tissue, Δδ¹³C values ranged from −3.23‰ to 2.06‰, with a mean of −0.09± 0.84‰ (SD), whereas Δδ¹⁵N values ranged from −1.86‰ to 4.47‰, with a mean of 0.24 ± 1.03‰. In contrast, changes in whole blood between nesting events spanned a narrower range, with Δδ¹³C values between −0.48‰ and 0.25‰ (mean 0.05 ± 0.13‰) and Δδ¹⁵N values between −0.12‰ and 0.39‰ (mean 0.10 ± 0.09‰). Estimated effects of time between sampling events on isotopic change were generally small for both tissues. For epidermis Δδ¹³C values, the time between sampling events model was the best supported based on AICc whereas models including year were substantially less supported (ΔAICc > 2). Estimated effects of time between sampling events were small (linear regression: β = –0.006 ± 0.005 SE , t = –1.19, p = 0.24, Fig. 3), suggesting limited temporal change across the nesting season. Similarly, epidermis Δδ¹⁵N values showed only weak support for a positive relationship with time between sampling events (linear regression: β = 0.011 ± 0.007 SE, t = 1.71, p = 0.09, Fig. 3). Models including year effects received comparatively less support for Δδ¹⁵N values, and mixed-effects models including individual ID as a random intercept provided little improvement in model fit. For whole blood Δδ¹³C values, the model including time between sampling events had the best fit among candidate models, whereas models including year were substantially less supported (ΔAICc > 5). Estimated effects indicated a weak positive relationship between Δδ¹³C values and time between sampling events (linear regression: β = 0.003 ± 0.001 SE, t = 2.0, p = 0.06, Fig. 3). Similarly, for whole blood Δδ¹⁵N values, the time between sampling events model was the best supported, whereas models including year received comparatively little support (ΔAICc > 7). Estimated effects suggested a weak positive relationship between Δδ¹⁵N values and time between sampling events (linear regression: β = 0.002 ± 0.001 SE, t = 2.03, p = 0.06, Fig. 3). Across all analyses, year added no additional variation in isotopic change. Although no statistically significant trend in either Δδ¹³C and Δδ¹⁵N values was present, there were large differences in residual variation. Epidermis had large variation, while whole blood was more uniform (Fig. 3).
To assess how isotopic values correspond between tissue types, we examined the relationship between epidermis and whole blood isotopic composition. For δ¹³C values, the model explained approximately 41% of the variance between tissues (r² = 0.41), and the slope was significantly different from zero (slope = 1.19, 95% confidence interval = 0.94 – 1.48, p = 0.01). For δ¹⁵N values, the relationship between the tissue types was stronger with 73% of the variation explained by the model (r² = 0.73), and the slope was significantly different from zero (slope = 0.98, 95% confidence interval = 0.88 – 1.10, p < 0.001). These results indicate statistically significant linear relationships between tissues, and the conversion formulas provide a framework for translating isotopic values between tissue types in comparative studies (Fig. 4, Table 3).
| Isotope | Equation (EPI vs. WB) | Slope (95% CI) | r² | p-value |
|---|---|---|---|---|
| δ13C | EPI = 1.19 × WB + 5.41 | 1.19 (0.94 – 1.48) | 0.41 | 0.01 |
| δ15N | EPI = 0.99 × WB + 1.83 | 0.98 (0.88 – 1.10) | 0.71 | 0.001 |
Lipid content from samples in this study, as inferred from C:N ratios, are unlikely to affect the interpretation of isotopic results. Epidermis exhibited significantly greater variability in C:N ratios than whole blood (Levene’s test: F1, 541= 24.3, p < 0.001). However, the mean C:N ratio of epidermis (3.08 ± 0.18 SD) was lower than that of whole blood (3.59 ± 0.08 SD), indicating that despite higher variability, lipid levels in epidermis were not elevated overall and were unlikely to bias isotopic interpretations (Fig. 5). The RMA regression showed a significant negative relationship between δ¹³C values and C:N ratio across all samples (r² = 0.44, p < 0.001). However, tissue-specific models were weaker (epidermis r² = 0.03, p = 0.001; whole blood: r² = 0.04, p = 0.006).
Discussion
This study used stable isotope analysis of carbon and nitrogen to investigate how values vary among tissues and through time, and how these patterns can inform future studies of leatherback ecology. Our goal was to explore variability among individuals and tissues using samples from three tissue types. We identified two distinct isotopic groups using clustering analysis of both δ13C and δ15N values and three clusters using only δ13C values only in epidermis. These clusters suggest heterogeneity in the isotopic baselines among individuals and are consistent with the idea that leatherbacks forage in a variety of oceanographic regions prior to migration to the nesting beach (Rider et al., 2024; Robinson et al., 2016). Across the nesting season, we observed greater variability in epidermis samples compared to whole blood. Additionally, we observed significant relationships between epidermis and blood isotopic values for both δ¹³C and δ¹⁵N values, establishing a basis for cross-tissue comparisons in leatherbacks.
The diversity of habitats and/or large geographic ranges utilized by NWA leatherbacks (Bond & James, 2017; Eckert et al., 2006; Sasso et al., 2021) likely contributes to the wide range of δ¹³C and δ¹⁵N values observed in our study. Although cluster analysis of epidermis samples revealed three distinct isotopic groups, we cannot directly relate them to foraging areas without paired satellite tracking data. The discrepancy in δ¹⁵N values between nesting leatherbacks in this study and foraging leatherbacks in the literature is even more striking, with many nesting individuals exhibiting higher δ15N values than published datasets (e.g., Dodge et al., 2011; Wallace et al., 2014; Hsu, 2020). Higher values could reflect the variable use of foraging areas with differing δ15N baselines, interannual shifts in δ15N values at the base of the food web, or fasting during the nesting season. Measuring phenylalanine δ¹⁵N values via compound-specific isotope analysis would separate baseline effects from trophic effects (Chikaraishi et al., 2009; Nielsen et al., 2015). Distinguishing between these processes is essential, as baseline-driven enrichment has different ecological implications than enrichment resulting from feeding higher in the trophic chain.
Interannual variability in marine isotopic baselines may contribute to the differences in δ¹⁵N values observed among nesting seasons. The North Atlantic Oscillation (NAO) is a large-scale atmospheric pattern that shapes climate across the mid- and high latitudes of the Northern Hemisphere (Hurrell et al., 2003). North Atlantic Oscillation fluctuations influence ocean circulation, nutrient supply, and primary productivity, thereby altering the isotopic baselines. Previous work has identified relationships between NAO conditions and bulk δ¹⁵N values in Northwest Atlantic leatherbacks (Hetherington et al., 2018), suggesting that temporal changes in nitrogen cycling can transfer through pelagic food webs to consumers. Variation in nitrogen fixation and nutrient supply across the Atlantic may similarly contribute to interannual shifts in δ¹⁵N values at lower trophic levels (Espinasse et al., 2022), including jellyfish, which is the main food source in leatherbacks. Although our study did not directly evaluate oceanographic drivers, the relatively low δ¹⁵N values observed in some years may reflect broader variability in Atlantic nitrogen cycling and productivity. Future work could integrate isotopic baselines, oceanographic variables, and prey dynamics to test these relationships directly.
We are unable to explain the large variability in the isotopic composition of leatherback turtle epidermis between sampling events. However, based on studies of hard-shelled turtles, whole blood was expected to integrate dietary information over a shorter period than epidermis because of differences in tissue-specific isotope turnover rates (Reich et al., 2008). Whether these turnover rates apply similarly to adult leatherbacks remains uncertain because of differences in physiology, growth, and reproductive output between taxa. The stability of blood isotope values over the nesting season suggests that additional physiological factors are likely. Leatherbacks exhibit a form of endothermy, whereby they generate heat through the peripheral locomotory muscles (Davenport et al., 2015). Tissue turnover rates are known to be faster for endotherms than ectotherms (Vander Zanden et al., 2015a), and leatherbacks may occupy an intermediate position along this continuum. The overall variation in δ¹³C and δ¹⁵N values was broadly comparable among tissue types, indicating that epidermis was not consistently more variable than blood at the population level. Rather, the main difference of change observed was within individuals across repeated sampling events, with epidermis exhibiting greater short-term variation than whole blood. Therefore, future studies might benefit from prioritizing stable isotope analysis of various blood components (whole blood, red blood cells, and plasma) in leatherbacks.
Lipid content can influence δ¹³C values because lipids are naturally depleted in ¹³C relative to proteins and carbohydrates, potentially lowering ¹³C values and increasing isotopic variability (Logan et al., 2008; Post, 2002). Tissues with high lipid concentrations often exhibit elevated C:N ratios, and lipid correction is advised when C:N ratios exceed ~3.5 (Post et al., 2007). In our dataset, epidermis samples consistently had lower C:N ratios than whole blood, suggesting that lipid content in epidermis was relatively low. Previous research suggests that when dermal and epidermal layers are carefully separated, lipid extraction is unnecessary in marine turtle epidermis (Turner Tomaszewicz et al., 2017; Vander Zanden et al., 2014). Whereas the C:N ratio in whole blood in this study was slightly above 3.5, it is unlikely that it affected our results. Although the effects of lipid extraction on sea turtle blood have not been specifically evaluated, studies in other systems have reported minimal effects of lipid extraction on stable isotope values. In the arctic fox (Vulpes lagopus), lipid extraction of whole blood had minimal impact on mean C:N ratio, δ¹³C, and δ¹⁵N values (Tarroux et al., 2012). We also detected slightly greater variability in epidermal C:N ratios compared to whole blood. Such a relationship has also been reported in green turtles (Chelonia mydas; Vanderklift et al. 2020), in which tissues with higher C:N ratios tended to be more ¹³C-depleted. Together, the low C:N values and the δ¹³C–C:N relationship suggest that while lipids may have some influence, their overall contribution to isotopic variability between first and last epidermis samples was minor.
The possibility that fasting during migration or nesting could influence δ¹⁵N values in sea turtles remains largely untested. Studies in other organisms show that tissue catabolism during nutritional stress preferentially removes lighter isotopes (¹⁴N), leaving tissues enriched in ¹⁵N by roughly +0.5 ‰ (Fuller et al., 2005; Hertz et al., 2015). In theory, this enrichment could confound interpretations of diet or habitat use, especially if there are temporal differences in when samples are collected during the nesting season. Leatherbacks in the NWA likely exhibit a capital-breeding strategy, relying on stored reserves throughout the nesting period (Perrault et al., 2012, 2014, 2016; Plot et al., 2013). If fasting were driving the observed variation, we would also expect to see a consistent increase in δ¹⁵N values across all nesting females, which was not the case in our dataset with a slope close to 0. Whereas fasting cannot be entirely ruled out as a minor contributing factor, our results indicate it is unlikely to be the primary mechanism behind the δ¹⁵N variability observed here. To disentangle the effects of fasting, compound-specific isotope analysis of amino acids of a faster-turnover tissue (e.g., plasma) could help reveal underlying biochemical pathways and provide deeper insight into the fasting physiology of marine turtles (Whiteman et al., 2019).
While we offer meaningful contributions to the understanding of isotopic variation in leatherbacks, it is important to acknowledge constraints of this study. The absence of plasma samples in our analysis represents a missed opportunity to capture a more immediate reflection of isotopic incorporation. Moreover, our reliance on satellite-telemetry data from previous investigations, rather than direct tagging of the individuals sampled for this study, introduces a potential limitation. The integration of additional markers, alongside stable isotope analysis could enhance the conclusions made in this study.
Compound-specific isotopes have been used in other marine systems to study capital vs. income breeding strategies (Lübcker et al., 2020) and, along with bulk isotopes, can enhance our understanding of these reproductive strategies. Additionally, the analysis of epibiont community assemblages on individuals may offer an alternate approach to distinguishing between in-shore and off-shore movements (Nolte et al., 2020), and data from blood analytes (e.g., hematology, biochemistry) could shed light on how animal health relates to foraging strategy (Perrault et al., 2016; Stacy & Innis, 2017). In conjunction with bulk isotopes, these methods could enhance the understanding of leatherback ecology in the NWA region.
This study highlights isotopic variability within NWA leatherbacks and that tissue type could influence interpretation of stable isotope data in sea turtle studies. We found no consistent isotopic shifts across the nesting season, particularly in whole blood, which had less variability among individuals within a nesting season compared to epidermis. Whole blood may be a preferred tissue to collect over epidermis because of the large variability in epidermis among repeated samples from the same individual. Isotope values also differed across nesting seasons, likely reflecting environmental variability driving isotopic baselines. We therefore interpret comparisons with published foraging-region isotope values as broad ecological context rather than definitive geographic assignments. Additionally, the broad range of isotope values and isotopic clustering we found suggests heterogeneity in foraging areas with nesting females. These clustering results should not be interpreted as direct evidence of discrete foraging because the relationship between tissue isotope values and geographic location has not been established for NWA leatherbacks like other species within the region (e.g., Vander Zanden et al., 2015b). Together, these findings provide a framework for future studies integrating stable isotopes, oceanographic data, and animal tracking to better understand ecological variability in this population.


Acknowledgments
We are grateful to the staff at the Loggerhead Marinelife Center in Juno Beach, Florida, for their assistance with sample collection throughout this project. We also thank Jason Curtis at the Light Stable Isotope Mass Spectrometry Laboratory, University of Florida for his expertise and analytical support. Jaime Gillooly provided valuable feedback that helped shape these ideas, and to George Glen for guidance with data analyses. Finally, we thank the four anonymous reviewers for their constructive comments, which greatly improved the manuscript.
Author Contributions
CRN- Conceptualization, Data Curation, Formal Analysis, Investigation, Methodology, Writing – Original Draft, Writing – Review & Editing
JRP- Data Curation, Writing – Original Draft, Writing – Review & Editing
CMC- Data Curation, Writing – Review & Editing
HVZ- Conceptualization, Resources, Writing – Original Draft, Writing – Review & Editing
Data Availability
Data and relevant code are available on GitHub (https://github.com/CRNolte/Leatherback_Isotopes_Florida).
Transparent Peer Review
Results from the Transparent Peer Review can be found here.
Recommended Citation
Nolte, C. R., Perrault, J. R., Coppenrath, C. M., & Vander Zanden, H. B. (2026). A comparison of stable isotope values in epidermis and blood of nesting leatherback sea turtles in the Northwest Atlantic Ocean. Stacks Journal: 26016. https://doi.org/10.60102/stacks-26016
Conflicts of Interest
Funding Information
Frank Maturo Excellence Fund Award from the University of Florida Department of Biology Cynthia A. Melnick Memorial Fund Award from the University of Florida Department of Biology University of Florida Biodiversity Institute Graduate Student Fellowship Sigma Xi Grant in Aid of Research.
AI Use Statement
We used ChatGPT to assist with designing graphs, editing code, and refining sections of the first draft.
Copyright
© 2026 Christopher R. Nolte, Justin R. Perrault, Christina M. Coppenrath, & Hannah B. Vander Zanden. This article is open access and distributed under the terms and conditions of the Creative Commons Attribution (CC BY 4.0) license.
References
Anderson, M. J., & Walsh, D. C. I. (2013). PERMANOVA, ANOSIM, and the Mantel test in the face of heterogeneous dispersions: What null hypothesis are you testing? Ecological Monographs, 83(4), 557–574. https://doi.org/10.1890/12-2010.1
Aoki, D., Bishop, W., Page-Karjian, A., Guertin, J., Persaud, S., Shillinger, G. L., & Perrault, J. (2026). Evaluating the viability and animal welfare of acoustic telemetry to monitor post-nesting presence of leatherback sea turtles (Dermochelys coriacea). Animal Biotelemetry, 14, 31.
Arbizu, P. M. 2017. pairwiseAdonis: Pairwise multilevel comparison using adonis. R package version 0.4.
Barrow, L. M., Bjorndal, K. A., & Reich, K. J. (2008). Effects of preservation method on stable carbon and nitrogen isotope values. Physiological and Biochemical Zoology, 81(5), 688–693. https://doi.org/10.1086/588172
Bates, D., Mächler, M., Bolker, B., & Walker, S. (2015). Fitting linear mixed-effects models using lme4. Journal of Statistical Software, 67(1). https://doi.org/10.18637/jss.v067.i01
Bond, E. P., & James, M. C. (2017). Pre-nesting movements of leatherback sea turtles, Dermochelys coriacea, in the Western Atlantic. Frontiers in Marine Science, 4. https://doi.org/10.3389/fmars.2017.00223
Bostrom, B. L., Jones, T. T., Hastings, M., & Jones, D. R. (2010). Behaviour and physiology: The thermal strategy of leatherback turtles. PLoS ONE, 5(11), e13925. https://doi.org/10.1371/journal.pone.0013925
Burton, R. K., & Koch, P. L. (1999). Isotopic tracking of foraging and long-distance migration in northeastern Pacific pinnipeds. Oecologia, 119(4), 578–585. https://doi.org/10.1007/s004420050822
Busquets-Vass, G., Newsome, S. D., Pardo, M. A., Calambokidis, J., Aguíñiga-García, S., Páez-Rosas, D., Gómez-Gutiérrez, J., Enríquez-Paredes, L. M., & Gendron, D. (2021). Isotope-based inferences of the seasonal foraging and migratory strategies of blue whales in the eastern Pacific Ocean. Marine Environmental Research, 163, 105201. https://doi.org/10.1016/j.marenvres.2020.105201
Caut, S., Guirlet, E., Angulo, E., Das, K., & Girondot, M. (2008). Isotope analysis reveals foraging area dichotomy for Atlantic leatherback turtles. PLoS ONE, 3(3), e1845. https://doi.org/10.1371/journal.pone.0001845
Ceriani, S. A., Weishampel, J. F., Ehrhart, L. M., Mansfield, K. L., & Wunder, M. B. (2017). Foraging and recruitment hotspot dynamics for the largest Atlantic loggerhead turtle rookery. Scientific Reports, 7(1). https://doi.org/10.1038/s41598-017-17206-3
Chikaraishi, Y., Ogawa, N. O., Kashiyama, Y., Takano, Y., Suga, H., Tomitani, A., Miyashita, H., Kitazato, H., & Ohkouchi, N. (2009). Determination of aquatic food‐web structure based on compound‐specific nitrogen isotopic composition of amino acids. Limnology and Oceanography: Methods, 7(11), 740–750. https://doi.org/10.4319/lom.2009.7.740
Cloyed, C. S., DaCosta, K. P., Hodanbosi, M. R., & Carmichael, R. H. (2020). The effects of lipid extraction on δ ¹³C and δ ¹⁵N values and use of lipid-correction models across tissues, taxa and trophic groups. Methods in Ecology and Evolution, 11, 751–762.
Coplen, T. B. (2011). Guidelines and recommended terms for expression of stable‐isotope‐ratio and gas‐ratio measurement results. Rapid Communications in Mass Spectrometry, 25(17), 2538–2560. https://doi.org/10.1002/rcm.5129
Davenport, J., Jones, T. T., Work, T. M., & Balazs, G. H. (2015). Topsy-turvy: turning the counter-current heat exchange of leatherback turtles upside down. Biology Letters, 11(10). https://doi.org/10.1098/rsbl.2015.0592
Dodge, K. L., Logan, J. M., & Lutcavage, M. E. (2011). Foraging ecology of leatherback sea turtles in the Western North Atlantic determined through multi-tissue stable isotope analyses. Marine Biology, 158(12), 2813–2824. https://doi.org/10.1007/s00227-011-1780-x
Dutton, P. H., & Mcdonald, D. (1994). Use of pit tags to identify adult leatherbacks. Marine Turtle Newsletter, 67, 13–14.
Eckert, S. A., Bagley, D., Kubis, S., Ehrhart, L., Johnson, C., Stewart, K., & DeFreese, D. (2006). Internesting and postnesting movements and foraging habitats of leatherback sea turtles (Dermochelys coriacea) nesting in Florida. Chelonian Conservation and Biology, 5(2), 239–248. https://doi.org/10.2744/1071-8443(2006)5[239:iapmaf]2.0.co;2
Espinasse, B., Sturbois, A., Basedow, S. L., Hélaouët, P., Johns, D. G., Newton, J., & Trueman, C. N. (2022). Temporal dynamics in zooplankton δ13C and δ15N isoscapes for the North Atlantic Ocean: Decadal cycles, seasonality, and implications for predator ecology. Frontiers in Ecology and Evolution, 10. https://doi.org/10.3389/fevo.2022.986082
Figgener, C., Bernardo, J., & Plotkin, P. T. (2019). Beyond trophic morphology: stable isotopes reveal ubiquitous versatility in marine turtle trophic ecology. Biological Reviews, 94(6), 1947–1973. https://doi.org/10.1111/brv.12543
Florida Fish and Wildlife Conservation Commission. 2026. Sea Turtle Monitoring (the SNBS and INBS Programs). MyFWC. https://myfwc.com/research/wildlife/sea-turtles/nesting/monitoring/
Fossette, S., Hobson, V. J., Girard, C., Calmettes, B., Gaspar, P., Georges, J.-Y., & Hays, G. C. (2010). Spatio-temporal foraging patterns of a giant zooplanktivore, the leatherback turtle. Journal of Marine Systems, 81(3), 225–234. https://doi.org/10.1016/j.jmarsys.2009.12.002
Fouda, L., Negus, S. R. B., Lockley, E. C., Fairweather, K., Lopes, A., Lopes, A., Correia, S. M., Taxonera, A., Schofield, G., & Eizaguirre, C. (2024). Productive foraging grounds enhance maternal condition and offspring quality in a capital breeding species. Ecology and Evolution, 14(9). https://doi.org/10.1002/ece3.70137
Fuller, B. T., Fuller, J. L., Sage, N. E., Harris, D. A., O'Connell, T. C., & Hedges, R. E. M. (2005). Nitrogen balance and δ 15 N: why you're not what you eat during nutritional stress. Rapid Communications in Mass Spectrometry, 19(18), 2497–2506. https://doi.org/10.1002/rcm.2090
Hanson, N., Ounsley, J., Middlemas, S. J., Gilbey, J., & Todd, C. D. (2022). Inferring individual marine migration from otolith ecogeochemical signatures of a wide-ranging fish. Frontiers in Marine Science, 9. https://doi.org/10.3389/fmars.2022.1071081
Hays, G. C., & Hawkes, L. A. (2018). Satellite tracking sea turtles: Opportunities and challenges to address key questions. Frontiers in Marine Science, 5. https://doi.org/10.3389/fmars.2018.00432
Heaslip, S. G., Iverson, S. J., Bowen, W. D., & James, M. C. (2012). Jellyfish support high energy intake of leatherback sea turtles (Dermochelys coriacea): Video evidence from animal-borne cameras. PLoS ONE, 7(3), e33259. https://doi.org/10.1371/journal.pone.0033259
Hertz, E., Trudel, M., Cox, M. K., & Mazumder, A. (2015). Effects of fasting and nutritional restriction on the isotopic ratios of nitrogen and carbon: a meta‐analysis. Ecology and Evolution, 5(21), 4829–4839. https://doi.org/10.1002/ece3.1738
Hetherington, E. D., Seminoff, J. A., Dutton, P. H., Robison, L. C., Popp, B. N., & Kurle, C. M. (2018). Long-term trends in the foraging ecology and habitat use of an endangered species: an isotopic perspective. Oecologia, 188(4), 1273–1285. https://doi.org/10.1007/s00442-018-4279-z
Hobson, K. A. (2019). Application of isotopic methods to Tracking Animal movements. In Tracking Animal Migration with Stable Isotopes (pp. 85–115). Elsevier. https://doi.org/10.1016/b978-0-12-814723-8.00004-0
Hsu, S. (n.d.). Using stable isotopes to determine foraging areas of leatherback sea turtles. https://doi.org/10.31979/etd.6enb-qzww
Hurrell, J. W., Kushnir, Y., Ottersen, G., & Visbeck, M. (2003). An overview of the North Atlantic oscillation. In Geophysical Monograph Series (pp. 1–35). American Geophysical Union. https://doi.org/10.1029/134gm01
Komoroske, L. M., Jensen, M. P., Stewart, K. R., Shamblin, B. M., & Dutton, P. H. (2017). Advances in the application of genetics in Marine turtle biology and conservation. Frontiers in Marine Science, 4. https://doi.org/10.3389/fmars.2017.00156
Landrum, J. P., Altabet, M. A., & Montoya, J. P. (2011). Basin-scale distributions of stable nitrogen isotopes in the subtropical North Atlantic Ocean: Contribution of diazotroph nitrogen to particulate organic matter and mesozooplankton. Deep Sea Research Part I: Oceanographic Research Papers, 58(5), 615–625. https://doi.org/10.1016/j.dsr.2011.01.012
Legendre, P. (2024). lmodel2: Model II Regression (Version 1.7-4) [Computer software]. https://r-project.org
Logan, J. M., Jardine, T. D., Miller, T. J., Bunn, S. E., Cunjak, R. A., & Lutcavage, M. E. (2008). Lipid corrections in carbon and nitrogen stable isotope analyses: comparison of chemical extraction and modelling methods. Journal of Animal Ecology, 77(4), 838–846. https://doi.org/10.1111/j.1365-2656.2008.01394.x
Lübcker, N., Whiteman, J. P., Millar, R. P., de Bruyn, P. J. N., & Newsome, S. D. (2020). Fasting affects amino acid nitrogen isotope values: a new tool for identifying nitrogen balance of free-ranging mammals. Oecologia, 193(1), 53–65. https://doi.org/10.1007/s00442-020-04645-5
Magozzi, S., Yool, A., Vander Zanden, H. B., Wunder, M. B., & Trueman, C. N. (2017). Using ocean models to predict spatial and temporal variation in marine carbon isotopes. Ecosphere, 8(5). https://doi.org/10.1002/ecs2.1763
McMahon, K. W., Hamady, L. L., & Thorrold, S. R. (2013). A review of ecogeochemistry approaches to estimating movements of marine animals. Limnology and Oceanography, 58(2), 697–714. https://doi.org/10.4319/lo.2013.58.2.0697
Montoya, J. P. (2007). Natural abundance of ¹⁵N in marine planktonic ecosystems. Pages 176-201 in Stable Isotopes in Ecology and Environmental Science. Blackwell Publishing, Oxford, UK.
Nielsen, J. M., Popp, B. N., & Winder, M. (2015). Meta-analysis of amino acid stable nitrogen isotope ratios for estimating trophic position in marine organisms. Oecologia, 178(3), 631–642. https://doi.org/10.1007/s00442-015-3305-7
Nolte, C. R., Pfaff, M. C., de Lecea, A. M., le Gouvello, D., & Nel, R. (2020). Stable isotopes and epibiont communities reveal foraging habitats of nesting loggerhead turtles in the South West Indian Ocean. Marine Biology, 167(11). https://doi.org/10.1007/s00227-020-03767-x
Oksanen, J., G. L. Simpson, F. G. Blanchet, R. Kindt, P. Legendre, P. R. Minchin, R. B. O’Hara, P. Solymos, M. H. H. Stevens, E. Szoecs, H. Wagner, M. Barbour, M. Bedward, H. Bengtsson, B. Bolker, D. Borcard, T. Borman, G. Carvalho, M. Chirico, M. D. Caceres, S. Durand, H. B. A. Evangelista, R. FitzJohn, M. Friendly, B. Furneaux, G. Hannigan, I. Heida, M. O. Hill, L. Lahti, C. Martino, D. McGlinn, M.-H. Ouellette, E. R. Cunha, T. Smith, A. Stier, C. J. F. T. Braak, and J. Weedon. (2026). vegan: Community Ecology Package [Computer software].
Pajuelo, M., Bjorndal, K. A., Reich, K. J., Vander Zanden, H. B., Hawkes, L. A., & Bolten, A. B. (2012). Assignment of nesting loggerhead turtles to their foraging areas in the Northwest Atlantic using stable isotopes. Ecosphere, 3(10), 1–18. https://doi.org/10.1890/es12-00220.1
Perrault, J. R., Miller, D. L., Eads, E., Johnson, C., Merrill, A., Thompson, L. J., & Wyneken, J. (2012). Maternal health status correlates with nest success of leatherback sea turtles (Dermochelys coriacea) from Florida. PLoS ONE, 7(2), e31841. https://doi.org/10.1371/journal.pone.0031841
Perrault, J. R., Page-Karjian, A., & Miller, D. L. (2016). Nesting leatherback sea turtle (Dermochelys coriacea) packed cell volumes indicate decreased foraging during reproduction. Marine Biology, 163(11). https://doi.org/10.1007/s00227-016-3007-7
Peterson, B. J., & Fry, B. (1987). Stable isotopes in ecosystem studies. Annual Review of Ecology and Systematics, 18(1), 293–320. https://doi.org/10.1146/annurev.es.18.110187.001453
Plot, V., Jenkins, T., Robin, J.-P., Fossette, S., & Georges, J.-Y. (2013). Leatherback turtles are capital breeders: Morphometric and Physiological evidence from longitudinal monitoring. Physiological and Biochemical Zoology, 86(4), 385–397. https://doi.org/10.1086/671127
Post, D. M., Layman, C. A., Arrington, D. A., Takimoto, G., Quattrochi, J., & Montaña, C. G. (2007). Getting to the fat of the matter: models, methods and assumptions for dealing with lipids in stable isotope analyses. Oecologia, 152(1), 179–189. https://doi.org/10.1007/s00442-006-0630-x
Putman, N. (2018). Marine migrations. Current Biology, 28(17), R972-R976. https://doi.org/10.1016/j.cub.2018.07.036
Reich, K. J., Bjorndal, K. A., & Martínez del Rio, C. (2008). Effects of growth and tissue type on the kinetics of 13C and 15N incorporation in a rapidly growing ectotherm. Oecologia, 155(4), 651–663. https://doi.org/10.1007/s00442-007-0949-y
Rider, M. J., Avens, L., Haas, H. L., Hatch, J. M., Patel, S. H., & Sasso, C. R. (2024). Where the leatherbacks roam: movement behavior analyses reveal novel foraging locations along the Northwest Atlantic shelf. Frontiers in Marine Science, 11. https://doi.org/10.3389/fmars.2024.1325139
Robinson, N. J., Morreale, S. J., Nel, R., & Paladino, F. V. (2016). Coastal leatherback turtles reveal conservation hotspot. Scientific Reports, 6(1). https://doi.org/10.1038/srep37851
Sasso, C. R., Richards, P. M., Benson, S. R., Judge, M., Putman, N. F., Snodgrass, D., & Stacy, B. A. (2021). Leatherback turtles in the Eastern Gulf of Mexico: Foraging and migration behavior during the autumn and winter. Frontiers in Marine Science, 8. https://doi.org/10.3389/fmars.2021.660798
Scrucca, L., Fraley, C., Murphy, T. B., & Raftery, A. E. (2023). Model-based clustering. In Model-Based Clustering, Classification, and Density Estimation Using mclust in R (pp. 27–80). Chapman and Hall/CRC. https://doi.org/10.1201/9781003277965-3
Seminoff, J. A., Benson, S. R., Arthur, K. E., Eguchi, T., Dutton, P. H., Tapilatu, R. F., & Popp, B. N. (2012). Stable isotope tracking of endangered sea turtles: Validation with satellite telemetry and δ15N analysis of amino acids. PLoS ONE, 7(5), e37403. https://doi.org/10.1371/journal.pone.0037403
Seminoff, J. A., Bjorndal, K. A., & Bolten, A. B. (2007). Stable carbon and nitrogen isotope discrimination and turnover in pond sliders Trachemys scripta: Insights for trophic study of freshwater turtles. Copeia, 2007(3), 534–542. https://doi.org/10.1643/0045-8511(2007)2007[534:scanid]2.0.co;2
Seminoff, J. A., Jones, T. T., Eguchi, T., Hastings, M., & Jones, D. R. (2009). Stable carbon and nitrogen isotope discrimination in soft tissues of the leatherback turtle (Dermochelys coriacea): Insights for trophic studies of marine turtles. Journal of Experimental Marine Biology and Ecology, 381(1), 33–41. https://doi.org/10.1016/j.jembe.2009.08.018
Stacy, N. I., and C. J. Innis. (2017). Clinical pathology. In C. A. Manire, T. M. Norton, B. A. Stacy, C. J. Innis, and C. A. Harms (Eds.), Sea Turtle Health and Rehabilitation (pp. 147–208). Ross Publishing, USA.
Stewart, K., Sims, M., Meylan, A., Witherington, B., Brost, B., & Crowder, L. B. (2011). Leatherback nests increasing significantly in Florida, USA; trends assessed over 30 years using multilevel modeling. Ecological Applications, 21(1), 263–273. https://doi.org/10.1890/09-1838.1
Takai, N., Onaka, S., Ikeda, Y., Yatsu, A., Kidokoro, H., & Sakamoto, W. (2000). Geographical variations in carbon and nitrogen stable isotope ratios in squid. Journal of the Marine Biological Association of the United Kingdom, 80(4), 675–684. https://doi.org/10.1017/s0025315400002502
Tarroux, A., Bêty, J., Gauthier, G., & Berteaux, D. (2012). The marine side of a terrestrial carnivore: Intra-population variation in use of allochthonous resources by Arctic foxes. PLoS ONE, 7(8), e42427. https://doi.org/10.1371/journal.pone.0042427
Thomas, S. M., & Crowther, T. W. (2015). Predicting rates of isotopic turnover across the animal kingdom: a synthesis of existing data. Journal of Animal Ecology, 84(3), 861–870. https://doi.org/10.1111/1365-2656.12326
Thomson, J., Heithaus, M., Burkholder, D., Vaudo, J., Wirsing, A., & Dill, L. (2012). Site specialists, diet generalists? Isotopic variation, site fidelity, and foraging by loggerhead turtles in Shark Bay, Western Australia. Marine Ecology Progress Series, 453, 213–226. https://doi.org/10.3354/meps09637
Trueman, C. N., & St John Glew, K. (2019). Isotopic Tracking of marine Animal movement. In Tracking Animal Migration with Stable Isotopes (pp. 137–172). Elsevier. https://doi.org/10.1016/b978-0-12-814723-8.00006-4
Turner Tomaszewicz, C. N., Seminoff, J. A., Price, M., & Kurle, C. M. (2017). Stable isotope discrimination factors and between‐tissue isotope comparisons for bone and skin from captive and wild green sea turtles (Chelonia mydas). Rapid Communications in Mass Spectrometry, 31(22), 1903–1914. https://doi.org/10.1002/rcm.7974
Vanderklift, M. A., Pillans, R. D., Robson, N. A., Skrzypek, G., Stubbs, J. L., & Tucker, A. D. (2020). Comparisons of stable isotope composition among tissues of green turtles. Rapid Communications in Mass Spectrometry, 34(16). https://doi.org/10.1002/rcm.8839
Vander Zanden, H. B., Pfaller, J. B., Reich, K. J., Pajuelo, M., Bolten, A. B., Williams, K. L., Frick, M. G., Shamblin, B. M., Nairn, C. J., & Bjorndal, K. A. (2014). Foraging areas differentially affect reproductive output and interpretation of trends in abundance of loggerhead turtles. Marine Biology, 161(3), 585–598. https://doi.org/10.1007/s00227-013-2361-y
Vander Zanden, H. B., Tucker, A. D., Hart, K. M., Lamont, M. M., Fujisaki, I., Addison, D. S., Mansfield, K. L., Phillips, K. F., Wunder, M. B., Bowen, G. J., Pajuelo, M., Bolten, A. B., & Bjorndal, K. A. (2015). Determining origin in a migratory marine vertebrate: a novel method to integrate stable isotopes and satellite tracking. Ecological Applications, 25(2), 320–335. https://doi.org/10.1890/14-0581.1
Vander Zanden, M. J., Clayton, M. K., Moody, E. K., Solomon, C. T., & Weidel, B. C. (2015). Stable isotope turnover and half-life in animal tissues: A literature synthesis. PLOS ONE, 10(1), e0116182. https://doi.org/10.1371/journal.pone.0116182
Walker, B. D., & McCarthy, M. D. (2012). Elemental and isotopic characterization of dissolved and particulate organic matter in a unique California upwelling system: Importance of size and composition in the export of labile material. Limnology and Oceanography, 57(6), 1757–1774. https://doi.org/10.4319/lo.2012.57.6.1757
Wallace, B. P., Schumacher, J., Seminoff, J. A., & James, M. C. (2014). Biological and environmental influences on the trophic ecology of leatherback turtles in the northwest Atlantic Ocean. Marine Biology, 161(8), 1711–1724. https://doi.org/10.1007/s00227-014-2467-x
Whiteman, J. P., Elliott Smith, E. A., Besser, A. C., & Newsome, S. D. (2019). A guide to using compound-specific stable isotope analysis to study the fates of molecules in organisms and ecosystems. Diversity, 11(1), 8. https://doi.org/10.3390/d11010008