Environmental Correlates of Breeding Bird Diversity in Commercial Parking Lots in Binghamton, New York
CollaboratorsReviewers can opt-in to be listed as a Collaborator on the manuscript as recognition for their contributions.: Danielle Gay + 3 other reviewers
* This article is part of a Special Issue from the Urban Wildlife Working Group.
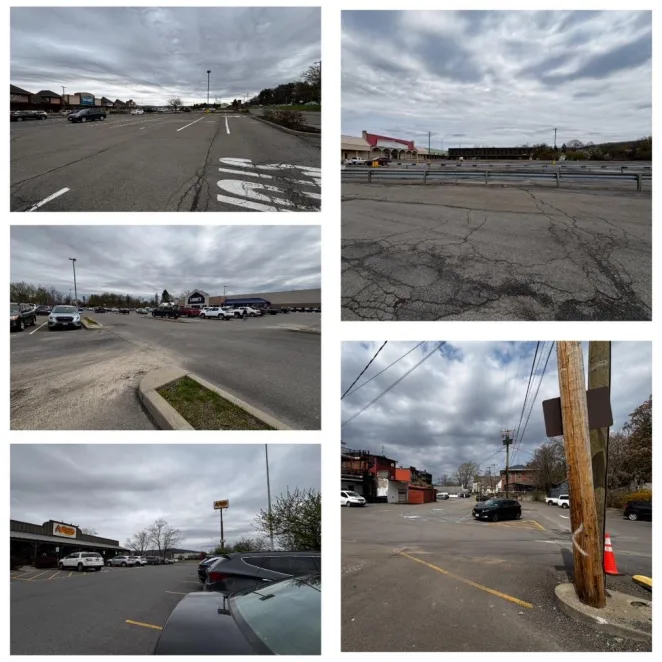
Abstract photo. The five parking lots surveyed during our study.
Abstract
Increased urbanization has required birds, especially during the breeding season, to adapt to changing habitats, including utilizing parking lots for nesting and foraging. We evaluated breeding bird use of parking lots in Binghamton, New York, during the 2024 breeding season. We observed 29 total species and estimated species richness varied from 13 (SE = 2.15) to 27 (SE = 4.61) across the parking lots. Variation in species composition was associated with environmental and anthropogenic conditions within and around parking lots. This analysis provides fundamental information on how breeding season birds utilize parking lots.
Keywords: Urbanization, Species Richness, Bird Diversity
Introduction
Increasing urbanization has been associated with decreasing bird diversity (Santos et al., 2024), due in large part to habitat loss and decreases in bird species richness up to 76.5% in highly urbanized areas (Sol et al., 2014). A contributing factor to this habitat loss has been increased impervious surfaces (e.g., parking lots) (Lerman et al., 2021). Although parking lots lack vegetational structure as habitat, birds are still regularly observed using parking lots for a wide variety of reasons (e.g., foraging, mating, roosting, or even nesting); however, it is unknown which variables are closely associated with birds using parking lots. In this study, we aimed to evaluate the species richness and composition of parking lots located in the city of Binghamton, New York, to identify factors associated with bird use of parking lots.
Methods and Materials
Data collection and variable selection
The Binghamton Metropolitan area is ~3,171 km2 and has a human population of 243,971 (Census Reporter, 2026). During the 2024 breeding season (17 May- 21 July), we conducted 20-minute point counts from the centers of five randomly selected parking lots: Kmart®, Lowe’s®, Cracker Barrel®, The Shoppes at Vestal, and Roasted Coffee Bar (Figure 1). Each location was surveyed three times by the same observer between 07:00-10:00 on days without rain or winds >20 km/hour (Martin et al., 1997). We recorded visual and auditory detections, using the Merlin Bird ID mobile app (Cornell Lab of Ornithology, 2024) to aid in auditory identification.
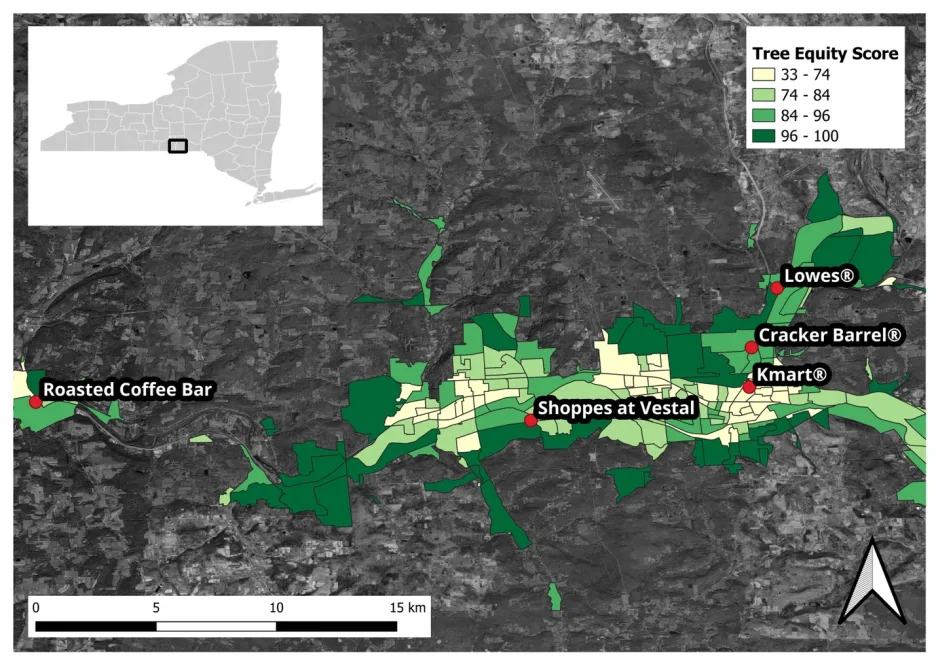
Figure 1. Map of Binghamton, New York, along with the locations of the five parking lots surveyed, along with their associated Tree Equity Scores (American Forests, 2023).
We evaluated eight variables that could affect species diversity across parking lots based on prior research on factors affecting urban birds (Peng et al., 2024). Variables were measured using Google Earth Pro, Version 7.3.6 (2024) and in-person observations and included perimeter-to-area ratio, distance (m) from a major roadway (federal, state, or county road), distance (m) from the nearest open water source, distance (m) from wooded patch (wooded areas of 1 km2), parking lot area (m2), number of light posts present, number of dumpsters present, and Tree Equity Score (TES) (American Forests, 2023). TES is a value that ranges from 0-100, that represents how well trees are distributed in relation to social and environmental factors, and is calculated from data provided by the US Census. We computed a weighted average TES based on US Census block size within a 1-km radius from the center of the parking lot.
Data analysis
We used program COMDYN4 to estimate species richness and overlap among parking lots while accounting for imperfect detectability (Hines et al., 1999), enabling pairwise comparisons of species overlap. COMDYN4 uses presence/absence data. As an additional analysis of species composition, we analyzed relative abundance data with a Nonmetric Multidimensional Scaling (NMDS) to analyze patterns in dissimilarity in species composition in relation to each parking lot, and a Principal Component Analysis (PCA) to observe how variables relate to each other.
Results
We detected a total of 29 bird species across all five lots (Supplement 1). Species richness estimates from COMDYN4 showed that The Shoppes at Vestal had the highest estimated species richness value of 27 species, while Roasted Coffee Bar had the lowest at 13 species (Figure 2).
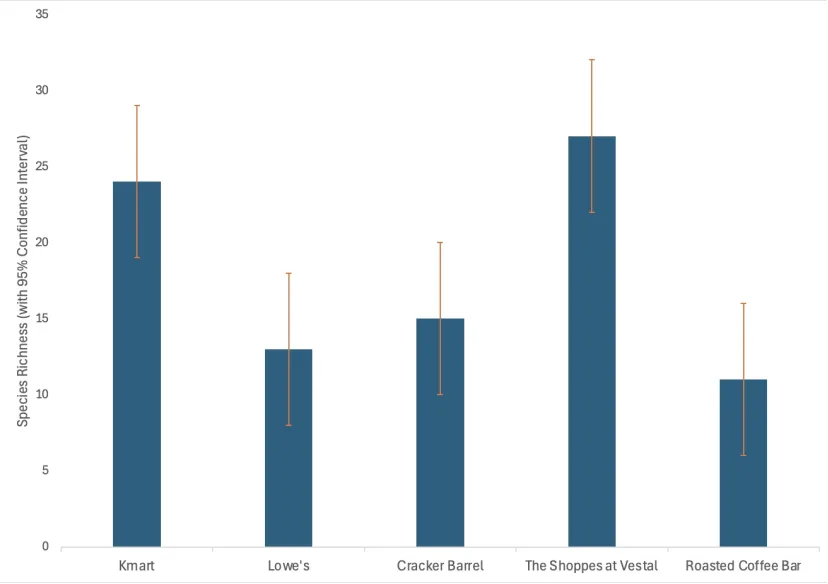
Figure 2. Species richness estimates based on three surveys conducted across each of the five observed parking lots, along with the associated 95% confidence intervals.
The COMDYN4 analysis revealed that most pairwise comparisons included 100% species overlap (Supplement 2), indicating a high degree of similarity among species across parking lots. Estimates that did not include 100% ranged from a low of 20% species overlap between the Shoppes versus Roasted Coffee Bar to 61% species overlap between Lowe’s versus Roasted Coffee Bar (Table 1).
| Important Comparisons | Percent Species Overlap | Confidence Interval |
|---|---|---|
| Kmart vs. Lowe’s | 59% | (31%-71%) |
| Kmart vs. Cracker Barrel | 41% | (30%-80%) |
| Kmart vs. Roasted Coffee Bar | 31% | (17%-53%) |
| Lowe’s vs. Roasted Coffee Bar | 61% | (36%-86%) |
| The Shoppes at Vestal vs. Roasted Coffee Bar | 20% | (10%-38%) |
Kmart® and The Shoppes at Vestal had similar estimated species richness and composition as indicated by the NMDS ordination (Figure 3). Although Lowe’s®, Cracker Barrel®, and Roasted Coffee Bar had similar estimated richness, their species compositions differed. The NMDS also revealed species uniquely associated with specific lots; e.g., Chipping Sparrow (CHSP) and Brown Creeper (BRCR) were detected only at Cracker Barrel® parking lot (Figure 3). Species near the center of the ordination, such as the House Sparrow (HOSP), occurred across multiple parking lots.
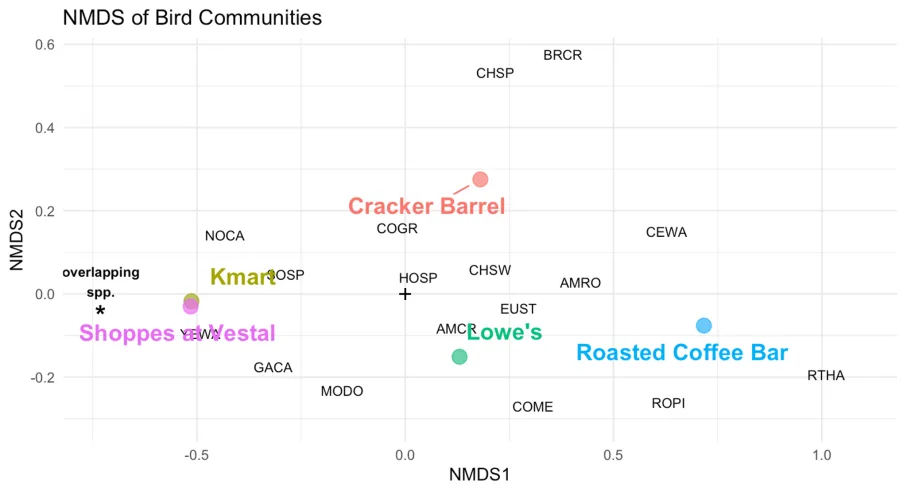
Figure 3. The NMDS analysis output, where each species is denoted by its four-letter species code (US Geological Survey, 2026). The asterisk indicates 11 overlapping species: American Goldfinch, Black-capped Chickadee, Blue Jay, Carolina Wren, Downy Woodpecker, Eastern Meadowlark, Fish Crow, House Finch, Killdeer, Red-winged Blackbird, and Tree Swallow. The plus sign indicates the center of the intersection of the axes in the ordination space.
With regard to the PCA, distance from major roadway, number of dumpsters, light posts, and parking lot area were found to be positively associated with bird diversity along Dimension 1 (Figure 4). In contrast, TES and perimeter-to-area ratio of parking lots were negatively associated with bird diversity along Dimension 1. Along Dimension 2, distance from wooded areas and distance from water were negatively associated with bird diversity.
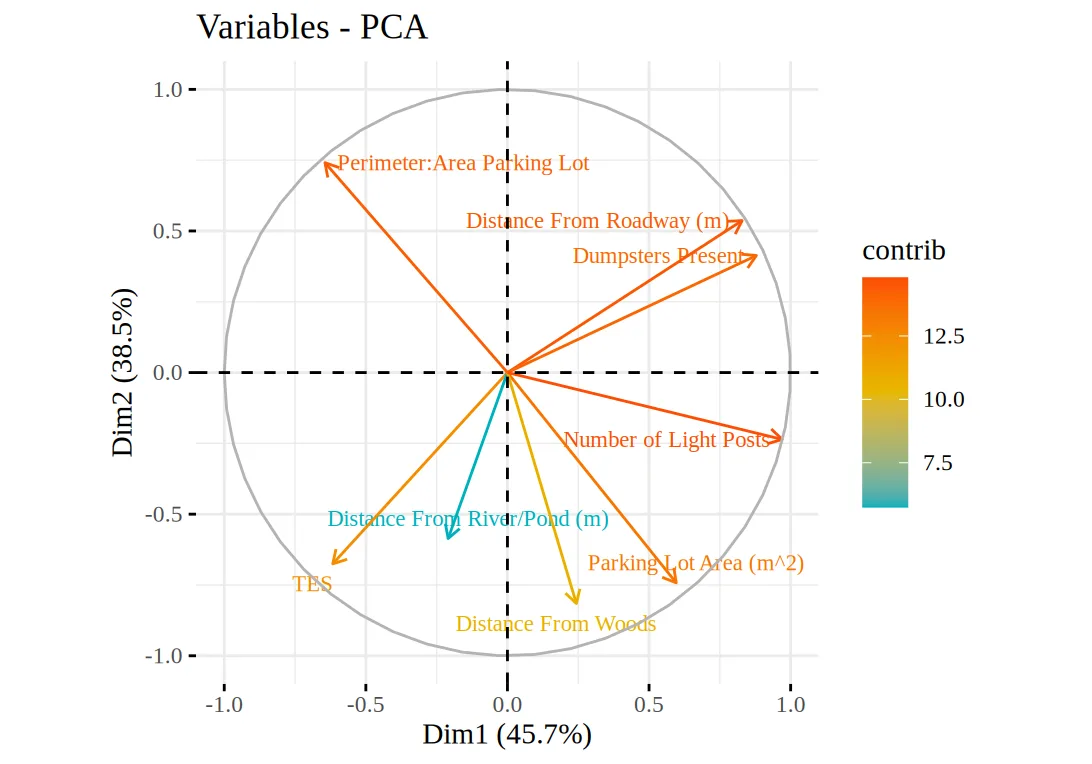
Figure 4. Loading plot of the PCA analysis. Dimension one (Dim1) is shown on the horizontal axis, with positive variables within this dimension pointing to the right on the horizontal axis, and negative variables pointing to the left. Dimension two (Dim2) is shown on the vertical axis, with positively correlated variables within this dimension pointing up the vertical axis, while negatively correlated variables downwards. The legend indicates the contribution strength of each variable to each PCA element.
Discussion
A significant finding from our study was the variability in species composition among parking lots. Several lots had similar estimated species richness but differed in composition, likely reflecting variation in the number of light posts and dumpsters and the distance from roads, as suggested by “Dim1” in the PCA. Parking lot area and proximity to wooded areas and water may also have influenced species distributions, as indicated by “Dim2” in the PCA.. For example, the Kmart® and The Shoppes at Vestal had high and comparable species richness and overlapping species composition, possibly because they were located at similar distances from wooded areas and had a comparable number of light posts that provided perching opportunities. In contrast, the low species overlap between The Shoppes at Vestal and Roasted Coffee Bar may be related to differences in parking lot area (The Shoppes at Vestal’s area being 27,413 m2 and Roasted Coffee Bar’s area being 1757 m2), whereas greater overlap between Lowe’s® and Roasted Coffee Bar may reflect their similar proximity to water (Lowe’s® proximity being 327 m, while Roasted Coffee Bar’s proximity was 338 m) .
Bird diversity was negatively correlated with distance from wooded areas, suggesting that parking lots closer to wooded habitat support more diverse bird communities. Because birds likely nest in surrounding habitat rather than within parking lots, areas located closer to nesting and foraging habitat may receive greater use. TES was also negatively correlated with bird diversity, with its vector pointing to the left of the horizontal axis and downwards on the vertical axis, potentially reflecting edge effects, which influence bird community composition where different habitats meet (Manolis et al., 2002). Additionally, bird diversity was higher in parking lots farther from major roadways, possibly because they experienced less traffic-related noise, which can negatively affect bird communities (Perillo et al., 2017).
Future research should examine parking lots across varying landscapes and seasons while quantifying or experimentally modifying factors such as noise, light pollution, and proximity to natural habitats to better understand drivers of bird species composition and diversity. Studies should also compare generalist versus specialist species to determine how they utilize parking lots and how these spaces can be designed to support greater bird diversity.
Overall, our findings indicate that although parking lots can support comparable levels of bird species richness, variation in surrounding environmental factors likely influences species composition and diversity. Our results suggest that parking lots located near wooded areas have the greatest potential to support diverse bird communities. Accordingly, urban planners should prioritize conserving or restoring nearby green spaces as well as implementing bird friendly features (e.g., vegetation and structural elements that provide birds with suitable perching and foraging habitat) in parking lots that are near wooded areas. Integrating these features into parking lot design may enhance urban biodiversity without compromising parking functionality.
Supplemental Information
Supplement 1. A complete list of bird species encountered in this study is available at this Google Sheets link: https://docs.google.com/spreadsheets/d/1KD2pwGy9_D-hpXcsRkeKEmJNo2Ql6AsbSsmRAvCyVAc/edit?usp=sharing
Supplement 2. The COMDYN4 output from our study is available at this Google Sheets link: https://docs.google.com/spreadsheets/d/1AmTq4NbUitMLJbInw0KgrY2EkIlKd-3qQF9JjpWtW2c/edit?usp=sharing


Acknowledgments
We would like to thank Dr. Caitlin Cunningham, head of the Le Moyne Mathematics, Statistics, and Actuarial Sciences Department, for her assistance in interpreting statistical results.
Author Contributions
Allison Queor: Data collection, Data analysis, Article Writeup
Jason Lusicer: Data Analysis, Article Writeup
Data Availability
Data for Tree Equity Score can be accessed from treeequityscore.org.
Transparent Peer Review
Results from the Transparent Peer Review can be found here.
Recommended Citation
Queor, A. C. & Luscier, J. D. (2026). Environmental Correlates of Breeding Bird Diversity in Commercial Parking Lots in Binghamton, New York. Stacks Journal: 26022. https://doi.org/10.60102/stacks-26022
Conflicts of Interest
The authors declare no conflicts of interest.
Funding Information
Research was funded by the Le Moyne College Student Research Committee.
AI Use Statement
Copyright
© 2026 Allison C. Queor & Jason D. Luscier. This article is open access and distributed under the terms and conditions of the Creative Commons Attribution (CC BY 4.0) license.
References
American Forests. (2023). Tree Equity Score. Retrieved April 15, 2025, from treeequityscore.org
Census Reporter. (2026). Population in Binghamton Metropolitan Area. Retrieved March 24, 2026, from https://censusreporter.org/
Cornell Lab of Ornithology. (2024). Merlin Bird ID (Version 3.2). merlin.allaboutbirds.org
Google Earth Pro. (2024). Google Earth (Version 7.3.6) [Computer software]. https://earth.google.com/
Hines, J. E., Boulinier, T., Nichols, J. D., Sauer, J. R., & Pollock, K. H. (1999). COMDYN: software to study the dynamics of animal communities using a capture—recapture approach. Bird Study, 46(sup1), S209-S217. https://doi.org/10.1080/00063659909477247
Lerman, S. B., Narango, D. L., Avolio, M. L., Bratt, A. R., Engebretson, J. M., Groffman, P. M., Hall, S. J., Heffernan, J. B., Hobbie, S. E., Larson, K. L., Locke, D. H., Neill, C., Nelson, K. C., Padullés Cubino, J., & Trammell, T. L. E. (2021). Residential yard management and landscape cover affect urban bird community diversity across the continental USA. Ecological Applications, 31(8), e02455. https://doi.org/10.1002/eap.2455
Manolis, J. C., Andersen, D. E., & Cuthbert, F. J. (2002). Edge effect on nesting success of ground nesting birds near regenerating clearcuts in a forest-dominated landscape. The Auk, 119(4), 955. https://doi.org/10.1642/0004-8038(2002)119[0955:eeonso]2.0.co;2
Martin, T. E., Paine, C. R., Conway, C. J., Hochachka, W. M., Allen, P., & Jenkins, W. (1997). BBIRD field protocol. Montana Cooperative Wildlife Research Unit, University of Montana. http://pica.wru.umt.edu/BBIRD/
Peng, L., Liu, Q., Wang, Q., Si, X., Niu, H., & Zhang, H. (2024). Effects of urbanization and vegetation on bird diversity in a megacity of central China. Biological Conservation, 297, 110718. https://doi.org/10.1016/j.biocon.2024.110718
Perillo, A., Mazzoni, L. G., Passos, L. F., Goulart, V. D. L. R., Duca, C., & Young, R. J. (2017). Anthropogenic noise reduces bird species richness and diversity in urban parks. Ibis, 159(3), 638–646. https://doi.org/10.1111/ibi.12481
Santos, B. A., Alvarado, F., & Morante-Filho, J. C. (2024). Impacts of urbanization on multiple dimensions of bird diversity in Atlantic forest landscapes. Global Ecology and Conservation, 54, e03078. https://doi.org/10.1016/j.gecco.2024.e03078
Sol, D., González‐Lagos, C., Moreira, D., Maspons, J., & Lapiedra, O. (2014). Urbanisation tolerance and the loss of avian diversity. Ecology Letters, 17(8), 942–950. https://doi.org/10.1111/ele.12297
U.S. Geological Survey. (2026). Species table and recommended band sizes. Bird Banding Laboratory. https://www.pwrc.usgs.gov/BBL/Bander_Portal/login/speclist.php